Bitcoin Faces Fresh Danger As Miner Inflows To Binance Surge
Alex Smith
1 month ago
Bitcoin’s composite trend signal has shifted back into a “high bear” zone, according to researcher Axel Adler Jr., following a sharp three-week reversal from May highs around $82,500.
The cryptocurrency now trades just above the $74,500 support band, a level that aligns with the lower boundary of its 21-day Donchian channel.
A Pattern Taking Shape
Repeated failures to break past the $80,000 to $81,000 range have left a head-and-shoulders pattern forming on the daily chart.
The most recent lower high, set near $78,000, now sits as the right shoulder of that setup. A daily RSI reading below 50 adds to the bearish lean, reflecting limited strength during recent price recoveries.
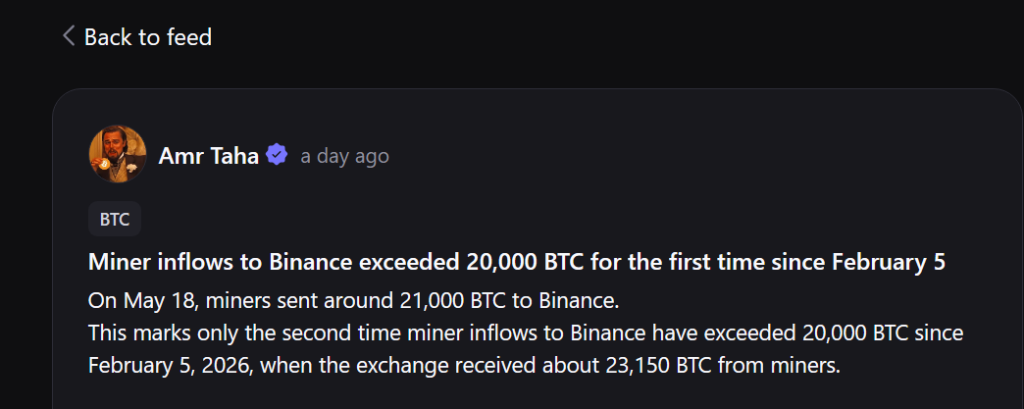
On May 18, miners moved roughly 21,000 BTC to Binance — the second-largest such transfer this year, trailing only the 23,150 BTC sent on February 5.
Analyst Amr Taha flagged the move, noting that large miner deposits to exchanges typically signal potential selling as miners convert holdings to cover operating costs.
Demand Failing To Keep Pace
Despite the surge in supply hitting the exchange, the price reaction stayed relatively calm. Binance’s total BTC reserves climbed from about 618,600 on May 6 to nearly 634,000 by May 26, yet no aggressive sell-off followed.
The more pressing concern may not be miner activity at all. Glassnode data shows spot volume delta slipping back into net sell-side territory after Bitcoin was rejected near the low $80,000s.
Without a return of spot buying, the market risks slipping back into the choppy, seller-dominated conditions that capped prices earlier in the year.
The realized profit/loss ratio currently stands at 1.56 — well below the two to five range associated with stronger bull market conditions. That reading points to moderate buying conviction at best during the recent price bounce.
$75,000 Becomes The Line
The $74,500 to $75,000 zone is now being watched closely across multiple analytical frameworks. Adler identifies $74,500 as critical support, while technical analysis places the same area at the neckline of the broader chart pattern.
A confirmed break below that level would expose the next major support near $70,400. For now, the market is holding — but the balance of supply, weak demand, and a deteriorating momentum picture has put that hold under serious strain.
Featured image from Adobe Stock, chart from TradingView
Related Articles
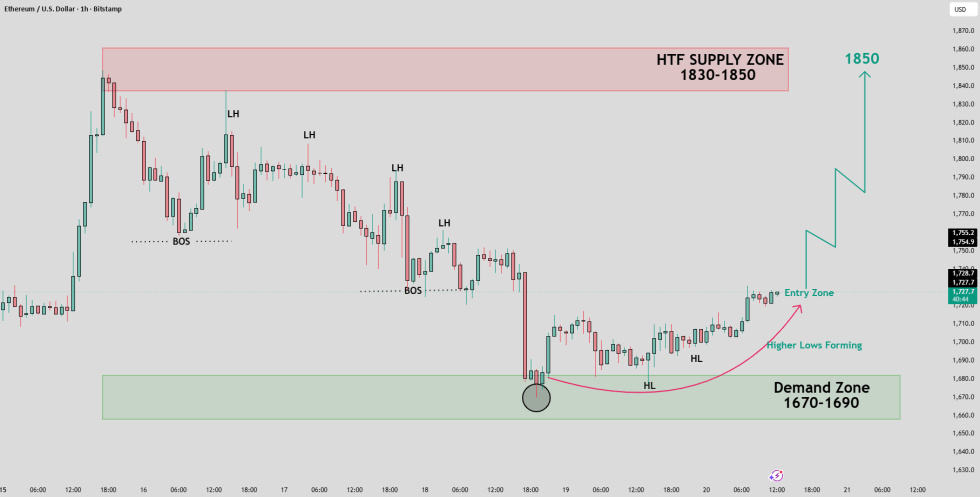
Ethereum Price Setup Targets $1,850 As Buyers Defend Key Demand Zone
A TradingView analyst says Ethereum could target $1,850 if buyers defend the $1,...
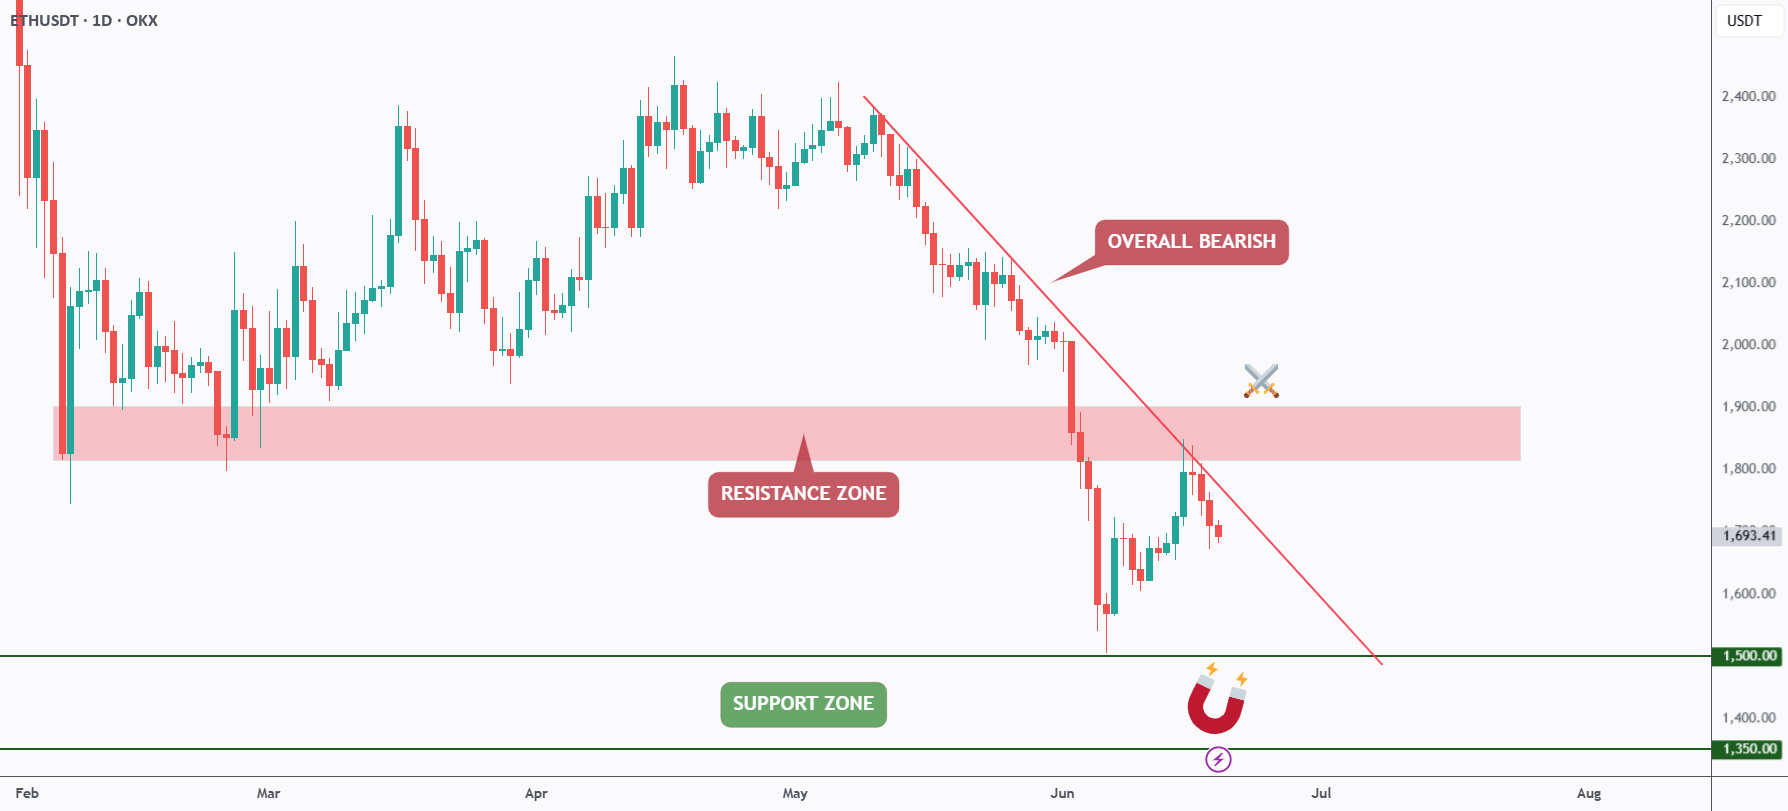
Ethereum Bears Keep Control As ETH Rejects Trendline Resistance
A TradingView analyst says Ethereum remains bearish below a falling trendline, w...
ETH/BTC Ratio Falls Back To Early-2023 Levels As Traders Debate Ethereum Value
An X analyst says ETH/BTC is back near 0.027, while a TradingView chart shows ET...
XRP Reversal Setup Forms Around Harmonic Pattern And Key Support Zone
A TradingView analyst says XRP is testing a technically important support zone s...