Bitcoin Network Activity Index Keeps Declining: Demand Still Weak?
Alex Smith
2 months ago

CryptoQuant’s Network Activity Index for Bitcoin has been locked in a downtrend, suggesting that demand for using the blockchain remains weak.
CryptoQuant’s Bitcoin Network Activity Index Has Been Cooling Off
As highlighted by CryptoQuant community analyst Maartunn in an X post, Bitcoin on-chain activity has been cooling off recently. The indicator of relevance here is the “Network Activity Index” from analytics firm CryptoQuant, which combines several activity-related metrics to showcase the overall situation on the blockchain.
The indicators referred to by the index include active addresses (both receiving and sending), transactions (total and per block), UTXO count, and bytes per block.
Now, here is the chart shared by Maartunn that shows how the CryptoQuant Network Activity Index has changed for Bitcoin over its history:
As displayed in the above graph, the Bitcoin Network Activity Index has been following a downward trajectory recently, a sign that transaction activity on the blockchain has been waning.
Alongside this decline, the indicator has been stuck in the region below its 365-day moving average (MA), something that tends to correspond to bearish phases.
Interestingly, the red signal in the indicator has actually maintained since before the shift of winds that the market saw in the last quarter of 2025. This means that even though BTC observed a rally to new all-time highs (ATHs) during the year, the network activity was still in a state of decline. From the chart, it’s visible that this pattern was also witnessed during 2021; the second half of that year’s bull run saw the metric flash a bearish signal.
Given that the Bitcoin Network Activity Index has continued to be in a red zone recently, it would appear that demand for using the network has remained weak. It now only remains to be seen how long it will take before the indicator observes a reversal.
In some other news, on-chain analytics firm Glassnode has shared the data of its new indicator, the Accumulation Trend Score by Wallet Cohort, in an X post. This metric tells us about the 30-day accumulation behavior of the various Bitcoin investor groups.
As the below chart shows, the Accumulation Trend Score has been at neutral or red values across the market recently.
The orange-red levels for all Bitcoin groups indicate that investor behavior has leaned toward distribution recently. In contrast, some cohorts were participating in accumulation following the price crash in February.
BTC Price
At the time of writing, Bitcoin is floating around $70,900, up more than 2% over the last 24 hours.
Related Articles
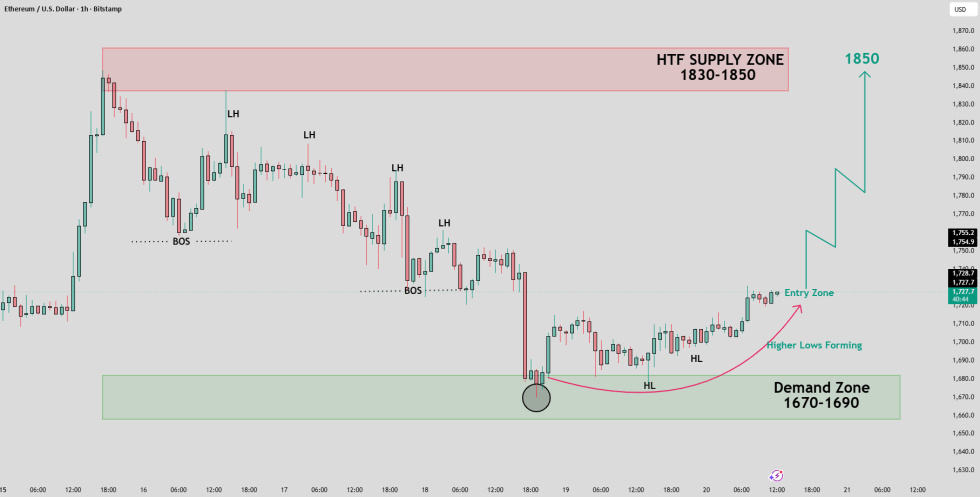
Ethereum Price Setup Targets $1,850 As Buyers Defend Key Demand Zone
A TradingView analyst says Ethereum could target $1,850 if buyers defend the $1,...
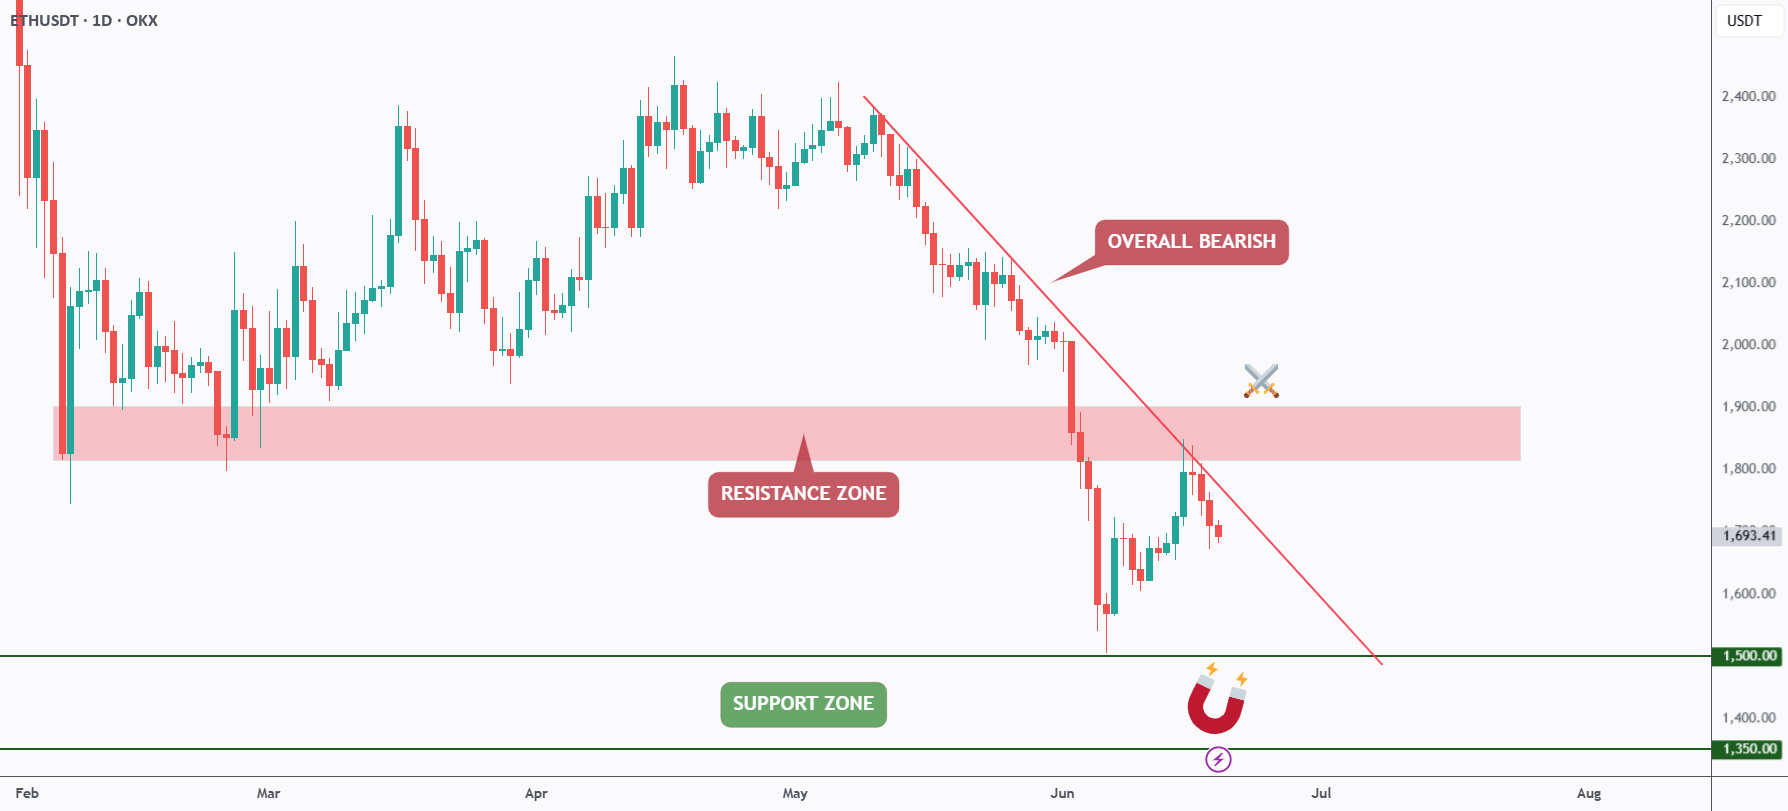
Ethereum Bears Keep Control As ETH Rejects Trendline Resistance
A TradingView analyst says Ethereum remains bearish below a falling trendline, w...
ETH/BTC Ratio Falls Back To Early-2023 Levels As Traders Debate Ethereum Value
An X analyst says ETH/BTC is back near 0.027, while a TradingView chart shows ET...
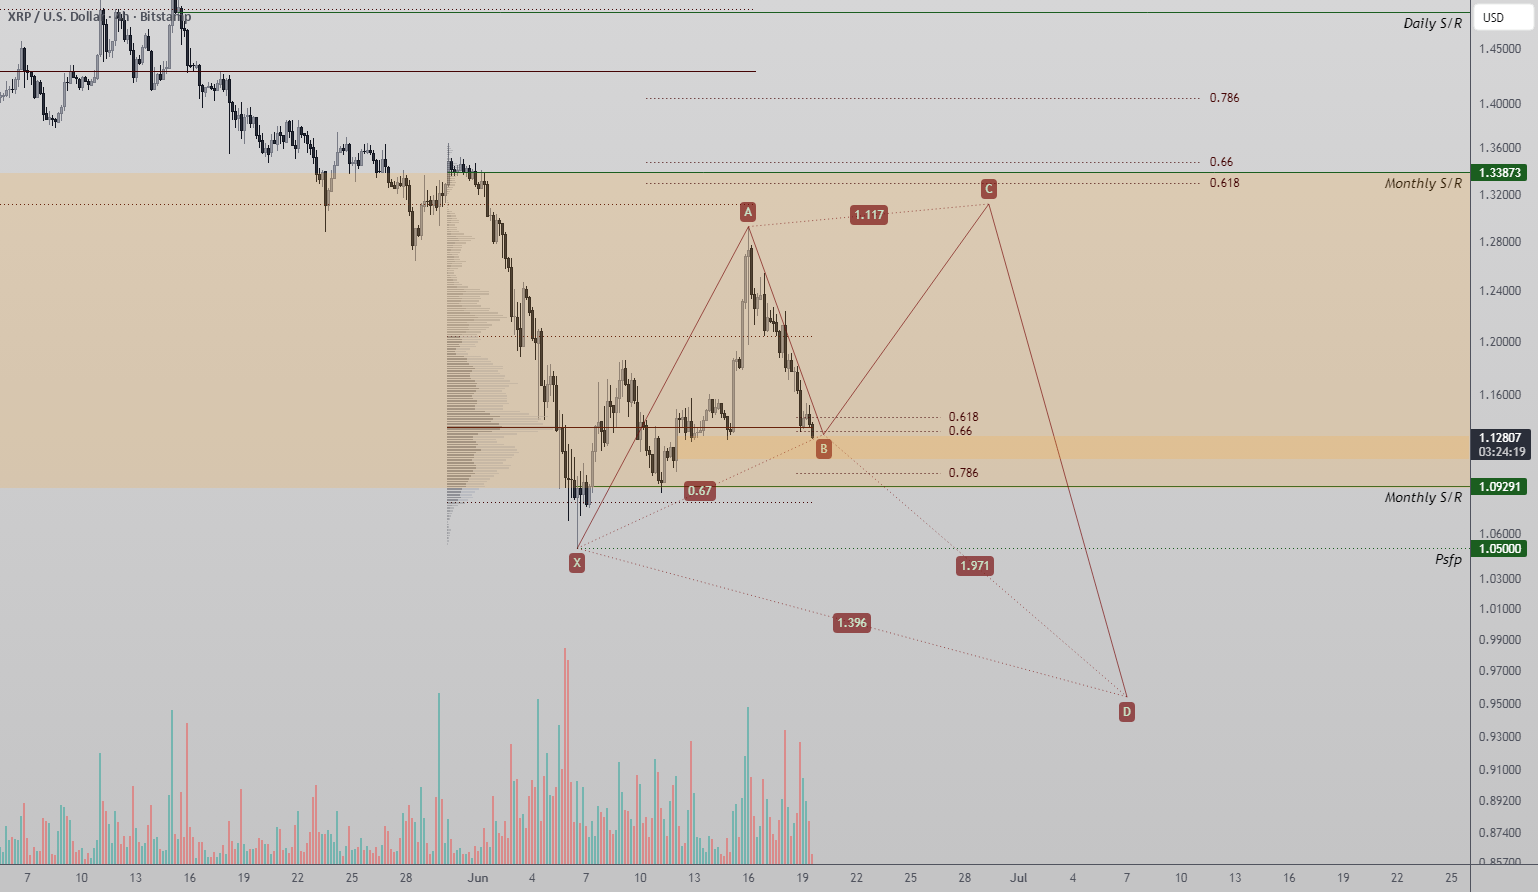
XRP Reversal Setup Forms Around Harmonic Pattern And Key Support Zone
A TradingView analyst says XRP is testing a technically important support zone s...