Bitcoin Price Attempts Comeback, but Technical Hurdles Challenge Bulls Ahead
Alex Smith
4 months ago
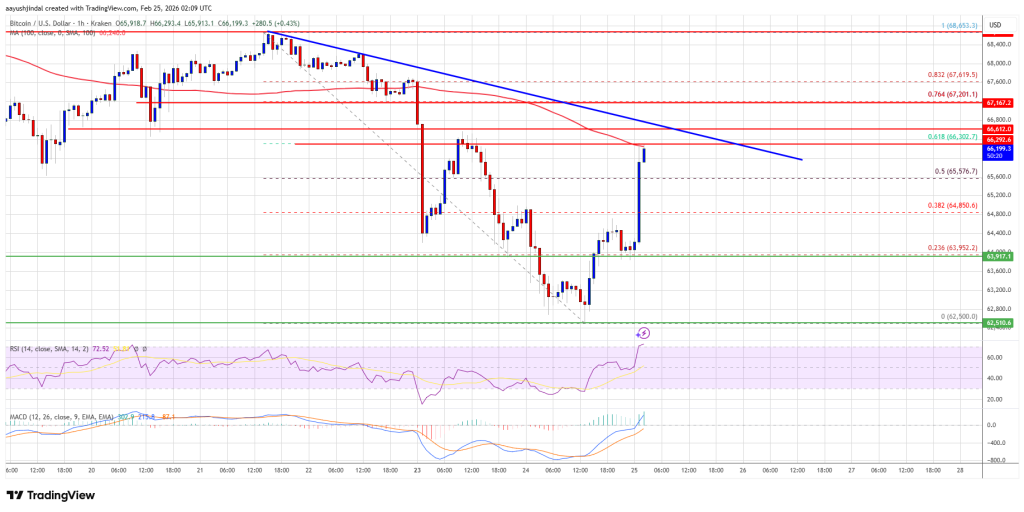
Bitcoin price failed to stay above $65,000 and dipped further. BTC is now recovering losses from $62,500 and faces hurdles near the $66,500 zone.
- Bitcoin started a fresh decline and traded below the $65,000 support.
- The price is trading below $66,500 and the 100 hourly simple moving average.
- There is a bearish trend line forming with resistance at $66,600 on the hourly chart of the BTC/USD pair (data feed from Kraken).
- The pair might dip again if it trades below the $65,500 and $65,000 levels.
Bitcoin Price Recovers Some Ground
Bitcoin price failed to remain stable above the $66,000 zone. BTC started a fresh decline and traded below the $65,000 support zone. There was a push below $64,000.
The price even spiked below $63,000. A low was formed at $62,500, and the price is now correcting some losses. There was a move above $65,000 and the 50% Fib retracement level of the recent decline from the $68,654 swing high to the $62,500 low.
Bitcoin is now trading below $66,500 and the 100 hourly simple moving average. If the price remains stable above $65,000, it could attempt a fresh increase. Immediate resistance is near the $66,500 level. There is also a bearish trend line forming with resistance at $66,600 on the hourly chart of the BTC/USD pair.
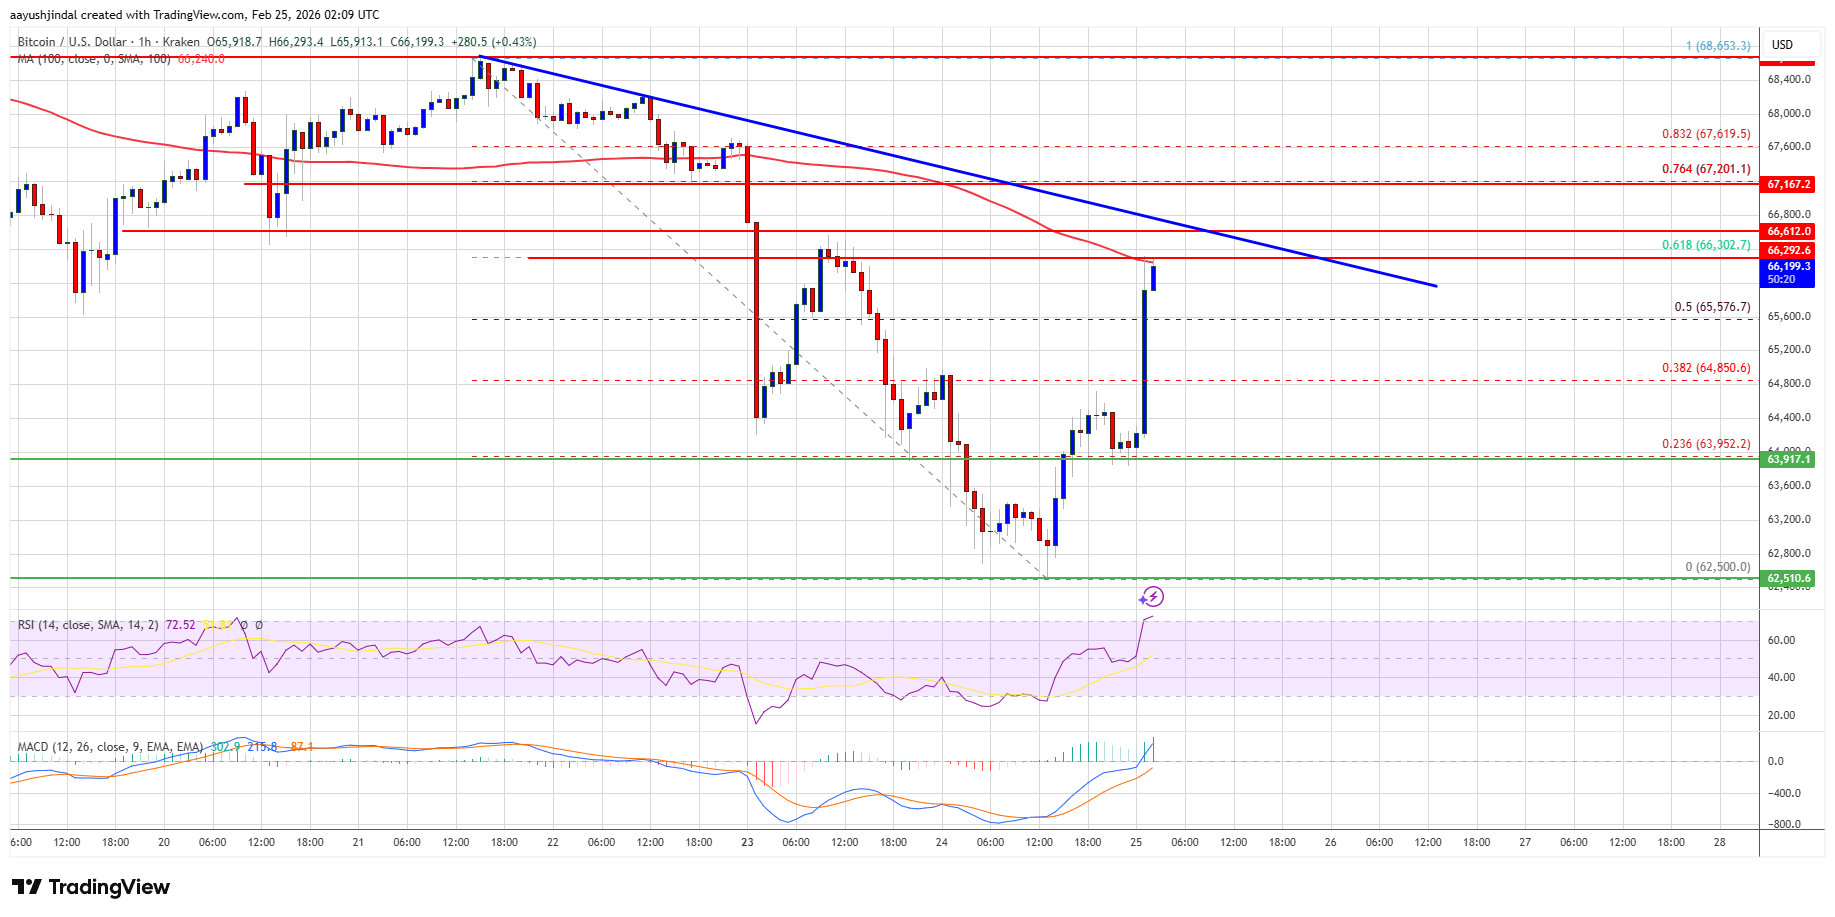
The first key resistance is near the $67,200 level or the 76.4% Fib retracement level of the recent decline from the $68,654 swing high to the $62,500 low. A close above the $67,200 resistance might send the price further higher. In the stated case, the price could rise and test the $68,000 resistance. Any more gains might send the price toward the $68,800 level. The next barrier for the bulls could be $69,200 and $69,500.
Another Decline In BTC?
If Bitcoin fails to rise above the $66,500 resistance zone, it could start another decline. Immediate support is near the $65,500 level. The first major support is near the $65,000 level.
The next support is now near the $64,200 zone. Any more losses might send the price toward the $63,500 support in the near term. The main support now sits at $62,500, below which BTC might struggle to recover in the near term.
Technical indicators:
Hourly MACD – The MACD is now gaining pace in the bullish zone.
Hourly RSI (Relative Strength Index) – The RSI for BTC/USD is now above the 50 level.
Major Support Levels – $65,500, followed by $65,000.
Major Resistance Levels – $66,500 and $67,200.
Related Articles
Bitcoin Bears Eye Lower Levels As TradingView Analysts Flag Failed Recovery
TradingView analysts warn Bitcoin's rebound may still be a resistance retest as...

Bitcoin Reclaims $63,500 As Traders Watch For Squeeze Toward $67,000
Bitcoin bulls are watching the $63,500 support zone as traders map a potential s...

Bitcoin Analysts Split Between Buyer Demand And Resistance Ceiling Near $65,000
Bitcoin analysts are split as BTC shows buyer demand but still faces a resistanc...

Bitcoin Faces Key $64,100 Resistance As Analyst Watches Fib Reaction Zone
An X analyst says Bitcoin is approaching local H4 resistance near $64,100, a lev...