Bitcoin Supply Map Reveals Key Support And Resistance Zones – Analyst
Alex Smith
2 months ago

According to market analyst Darkfost, Bitcoin’s price-based supply distribution is revealing critical zones that could define the asset’s near-term trajectory. This latest piece of important on-chain data is offering a clearer picture of where the market may be headed next, following the positive price action observed in early April.
61% Of BTC Supply In Profit Despite Bear Season
In an X post on April 11, Darkfost shares an insight into Bitcoin’s price structure based on its supply distribution pattern. At current prices, the renowned expert reports that approximately 61% of Bitcoin’s circulating supply was acquired below the spot price, leaving 39% purchased at higher levels. This positioning suggests that a majority of market participants remain in profit, a condition often associated with a more constructive market structure.
Interestingly, further data analysis reveals a notable concentration of investor activity in the $65,000- $70,000 range. While this zone reflects both buying and selling activity rather than pure accumulation, it still represents a key area where a significant volume of coins last changed hands. Because this range sits below the current price, it is interpreted as a potential support floor and a good accumulation zone for smart money investors.
Here is a snapshot of BTC supply distribution by price.
At current price levels, 61% of BTC has been acquired below this level, while 39% was bought at higher prices.
︎ We can observe a clear cluster of investor activity between $65,000 and $70,000. I refer to activity… pic.twitter.com/gDMbEPTjUN
— Darkfost (@Darkfost_Coc) April 11, 2026
On the upside, a similar cluster of activity has emerged between $90,000 and $95,000, which Darkfost expects could act as a formidable resistance level. This is because market participants who acquired Bitcoin at this price range are likely to exit their positions once prices return to their cost basis, thereby creating a barrier to further upward movement.
However, Darkfost warns that not all activity clusters carry the same weight. The analyst considers the $85,000 region non-sequential from a technical standpoint, despite showing elevated transaction volume. This is largely due to the influence of exchange-related transfers, most notably a substantial transfer of nearly 800,000 BTC from Coinbase, which distorts the data and fails to reflect genuine investor sentiment or conviction.
Bitcoin Price Pocket Lies Above $75,000
Another key insight from the supply map is the presence of a relatively low-activity zone, often referred to as an “air pocket,” above $75,000. In this range, Bitcoin has historically seen limited trading activity, implying fewer barriers to price movement. As a result, if Bitcoin enters this zone with sufficient momentum, it could either move through it rapidly or undergo a brief consolidation phase before continuing higher. At press time, the premier cryptocurrency trades at $71,535, up 6.45% over the last seven days.
Related Articles
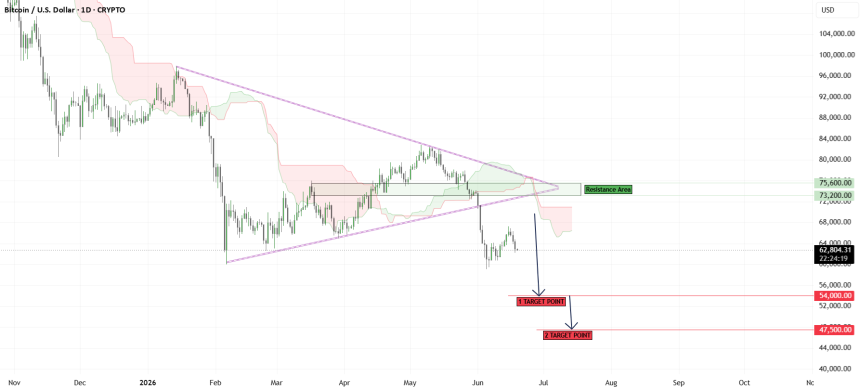
Bitcoin Bears Eye Lower Levels As TradingView Analysts Flag Failed Recovery
TradingView analysts warn Bitcoin's rebound may still be a resistance retest as...

Bitcoin Reclaims $63,500 As Traders Watch For Squeeze Toward $67,000
Bitcoin bulls are watching the $63,500 support zone as traders map a potential s...

Bitcoin Analysts Split Between Buyer Demand And Resistance Ceiling Near $65,000
Bitcoin analysts are split as BTC shows buyer demand but still faces a resistanc...

Bitcoin Faces Key $64,100 Resistance As Analyst Watches Fib Reaction Zone
An X analyst says Bitcoin is approaching local H4 resistance near $64,100, a lev...