Bullish Breakout: PNB Forms Ascending Triangle Pattern Hinting at Short-Term Upside
Alex Smith
4 months ago

Synopsis: Punjab National Bank is forming an ascending triangle pattern on the 30-minute chart, indicating the potential for a short-term bullish breakout.
An ascending triangle is a bullish pattern with higher lows and a flat resistance, indicating rising buying pressure toward a potential breakout. The chart shows a bullish breakout above the horizontal resistance. Backed by strong volume, it indicates increasing buying pressure and a likely short-term upward move. On Friday, Punjab National Bank broke above the ascending triangle’s neckline on the 30-minute chart and stayed above Rs 128.7, boosting its bullish momentum.
In an ascending triangle, targets are set at nearby resistance or by adding the triangle’s height to the breakout. Traders watch volume and momentum for confirmation and may trail profits as the price rises.
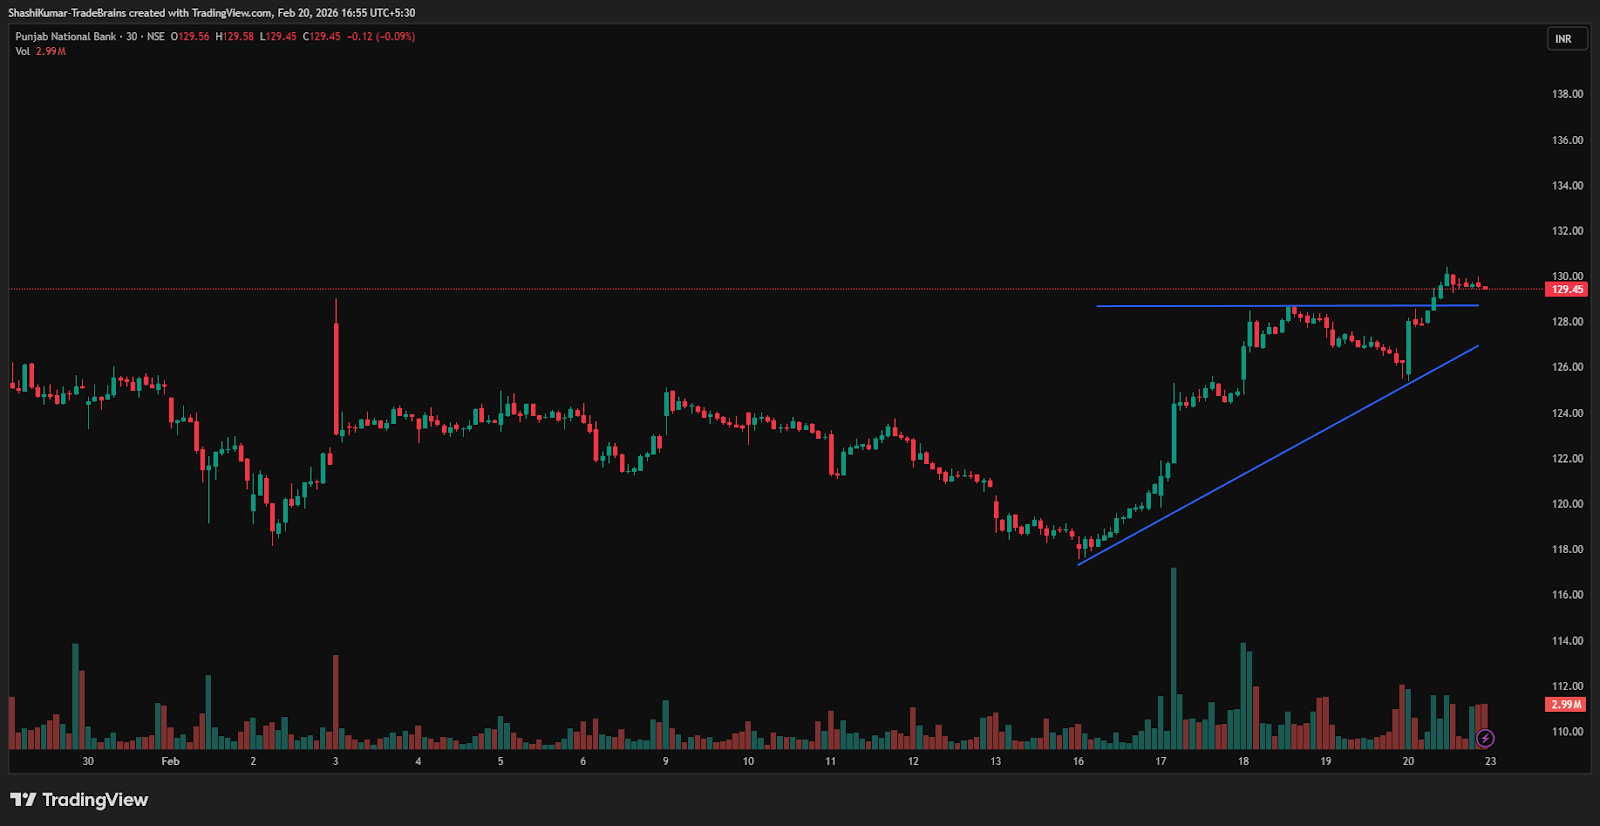
Punjab National Bank Chart: 30-minute Timeframe
Indicator Confirmation
- RSI: The daily RSI indicates bullish momentum, as it rose from 55.9 in the previous trading session to 61.3 on Friday, confirming the bullish reversal.
- MACD: On the daily time frame, the Blue MACD line was above the orange signal line, with the histogram turning green, indicating bullish momentum.
- Moving Averages: On the daily time frame, the 5-day moving average was above the 9-day moving average, further confirming a bullish trend.
- Price Volume Trend: The Price Volume Indicator confirms the uptrend, accompanied by a sharp increase in buying volume in the daily time frame.
Implications
The ascending triangle indicates potential upside, and staying above the Rs 128.7 support, especially with strong volume, would strengthen near-term bullish momentum.
About the stock
Founded in 1894, Punjab National Bank (PNB) is a leading Indian public sector bank headquartered in New Delhi. As of December 2025, the bank manages a global business of over Rs 28.9 lakh crore, serving millions through an extensive domestic and international network of branches and digital platforms.
Over the past month, Punjab National Bank has gained 2.96%. The stock has advanced 20.89% over the past six months and is up 35.38% compared to its level a year ago. For more such technical stock ideas, click here to view our research page.
Disclaimer: The views and investment tips expressed by investment experts/broking houses/rating agencies on tradebrains.in are their own, and not that of the website or its management. Investing in equities poses a risk of financial losses. Investors must therefore exercise due caution while investing or trading in stocks. Trade Brains Technologies Private Limited or the author are not liable for any losses caused as a result of the decision based on this article. Please consult your investment advisor before investing.
The post Bullish Breakout: PNB Forms Ascending Triangle Pattern Hinting at Short-Term Upside appeared first on Trade Brains.
Related Articles

L&T Finance, Just Dial, Indian Bank, and Other Top Stocks Announcing Q1 Results Today
Synopsis: Today, several major companies, including L&T Finance, Just Dial,...

Axis Bank Receives ‘Buy’ Call from Jefferies; Check the Upside Potential
Synopsis: Jefferies maintains a Buy rating on Axis Bank with a target price of ₹...

5 Stocks to Watch as India’s Digital Payments Boom Creates Opportunities Beyond Fintech
Synopsis: Behind India’s UPI success story sits a quieter network of enabl...

Mazagon Dock Receives ‘Sell’ Rating From Kotak Securities; Should Investors Worry?
Synopsis:- Kotak Institutional Equities has initiated coverage on Mazagon Dock S...