Bullish signal: Inverted head and shoulder pattern forms in this insurance stock
Alex Smith
2 months ago

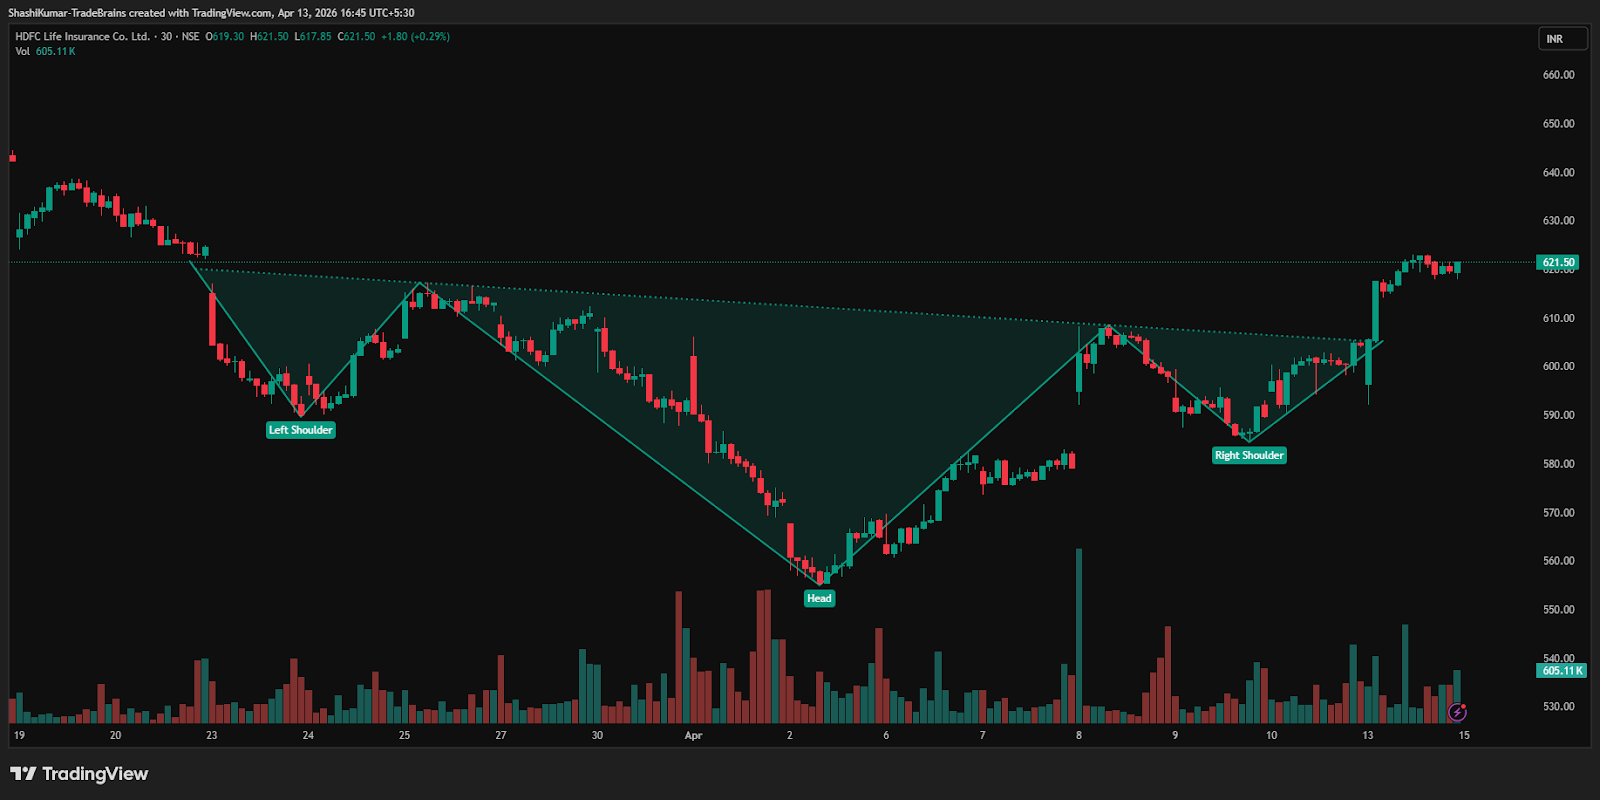
Synopsis: HDFC Life Insurance Company Ltd has formed an inverted head-and-shoulders pattern on the 30-minute chart, signalling a potential near-term bullish reversal.
The inverted head-and-shoulders pattern indicates fading selling pressure alongside a rise in buying interest. The inverted head-and-shoulders pattern features three troughs, where the middle trough forms the lowest point (the head) and the two outer troughs create higher lows (the shoulders). A breakout above the neckline signals a potential bullish reversal.
On Monday, HDFC Life Insurance Company Ltd broke above the neckline of an inverted head-and-shoulders pattern on the 30-minute chart. A sustained move above Rs 606 could pave the way for further upside, while a drop below this level may weaken the bullish outlook.
In an inverted head-and-shoulders pattern, targets are usually set at the nearest resistance level or estimated by projecting the distance from the head to the neckline upward. Traders typically trail profits while keeping a close eye on volume and momentum for confirmation.
HDFC Life Insurance Company Ltd Chart: 30-min Timeframe
Indicator Confirmation
RSI: The daily RSI indicates bullish momentum, as it rose from 42.56 in the previous trading session to 47.84 on Monday.
MACD: On the daily time frame, the blue MACD line was above the orange signal line, with the histogram turning green, indicating bullish momentum.
Moving Averages: On the daily time frame, the 5-day moving average was above the 9-day moving average, further confirming a bullish trend.
Price Volume Trend: The Price Volume Indicator confirms the uptrend, accompanied by a sharp increase in buying volume in the daily time frame.
Implications
The inverted head-and-shoulders pattern indicates a potential upward move. Holding above the Rs 606 support level, backed by strong volumes, would reinforce bullish momentum in the near term.
About the stock
Established in 2000, HDFC Life is a leading listed life insurer in India, offering over 70 individual and group products across protection, savings, investment, pension, annuity, and health. With a strong nationwide presence, it operates through extensive branches and 500+ distribution partners, including banks and brokers. A robust network of financial consultants supports the company, enabling it to serve diverse customer needs effectively.
Over the past month, HDFC Life Insurance Company Ltd has declined by 0.83%. Over a six-month period, the stock has dropped by 16.88%, and on a year-over-year basis, it is down 11.94%. For more such technical stock ideas, click here to view our research page.
Disclaimer: The views and investment tips expressed by investment experts/broking houses/rating agencies on tradebrains.in are their own, and not that of the website or its management. Investing in equities poses a risk of financial losses. Investors must therefore exercise due caution while investing or trading in stocks. Trade Brains Technologies Private Limited or the author are not liable for any losses caused as a result of the decision based on this article. Please consult your investment advisor before investing.
The post Bullish signal: Inverted head and shoulder pattern forms in this insurance stock appeared first on Trade Brains.
Related Articles

5 Debt-Free Stocks with 5-Year ROE of Up to 44% to Add to Your Watchlist
Synopsis: Debt-free companies including Gillette India, BSE Ltd, and a few other...

5 Companies Supporting India’s Semiconductor Manufacturing Push
Synopsis: As global chipmakers look beyond China for supply chain diversificatio...

Alpine Texworld IPO: Check the GMP, Price Band, Financial Analysis and More
Synopsis: Alpine Texworld Limited’s ₹126.25 crore IPO opens on July 14, 20...

Mukul Agrawal Stock: Can This Precision Player Ride India’s $5.9 Billion Abrasives Opportunity?
Synopsis: India’s manufacturing sector is increasingly moving towards high...