Dogecoin Mirrors AMD’s Setup From Last Year, Analyst Claims
Alex Smith
5 months ago
Dogecoin’s pullback is starting to look like a setup, not a breakdown, at least according to crypto analyst Cantonese Cat (@cantonmeow), who says the meme coin is behaving the way AMD did before its turn higher last year.
Can Dogecoin Replicate The AMD Rally?
In a X post on Dec. 31, the analyst argued that slipping prices on weakening volume and growing public reluctance to be bullish is exactly what improves the trade’s risk/reward.
“I said that about AMD last year. I’m saying that about DOGE right now,” Cantonese Cat wrote. “The lower price goes down on low volume. The more worried influencers are to publicly be bullish on it. The less people care about this. The better risk-reward ratio there is.”
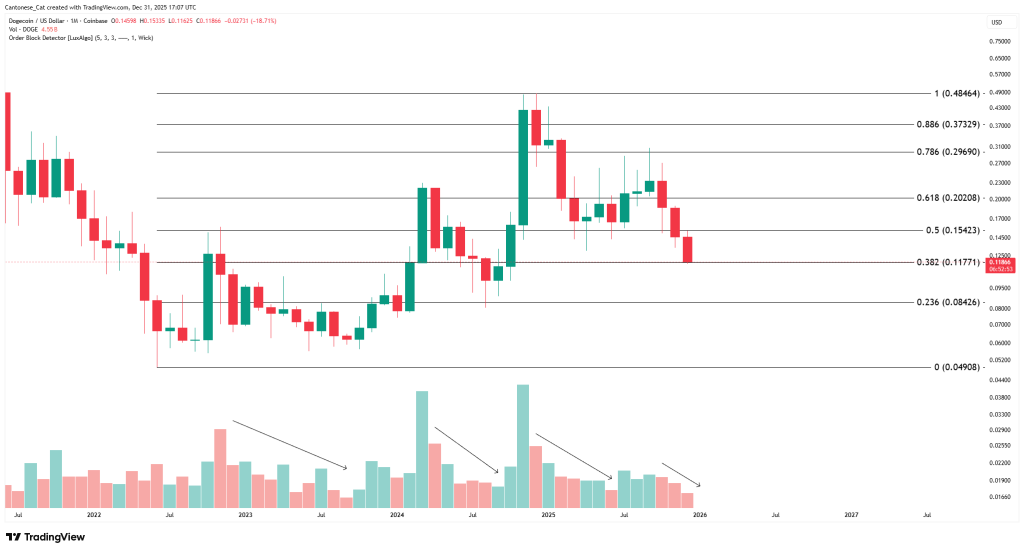
The Dec. 31 chart is built around Fibonacci retracement levels mapped from DOGE’s prior move, with key bands marked at roughly $0.373 (0.886), $0.297 (0.786), $0.202 (0.618), $0.154 (0.5), $0.118 (0.382), $0.084 (0.236) and a lower reference near $0.049 (0). In that view, DOGE is shown sliding into the 0.382 region (around $0.118), a level many technicians watch as a make-or-break area for whether a pullback remains corrective or risks turning into a deeper unwind.
Below price, Cantonese Cat’s volume bars are annotated with downward arrows, reinforcing the point made in the accompanying commentary: as DOGE moved lower, participation appeared to fade. For the analyst, that combination: declining price paired with softer volume and a more reluctant public tape fits a pattern where marginal sellers can exhaust without attracting aggressive new supply.
Long-Term Dogecoin Price Targets
Cantonese Cat’s earlier Dec. 20 post sets the broader roadmap, describing the preceding stretch as a prolonged downcycle and positioning the current phase as a corrective structure rather than a fresh trend.
“We’ve already had a 13 month bear market for DOGE, with my working hypothesis of this being likely a wave 2 correction prior to wave 3 explosion,” the analyst wrote. “The entire reason why this may play out is that it doesn’t feel likely right now, and you want me to stop posting.”
That Dec. 20 chart also projects upside targets using Fibonacci extensions, with levels plotted well above the prior range. The marked extension ladder includes roughly $0.90 (1.272), $1.25 (1.414), and $1.99 (1.618), with more aggressive levels further out near $4.78 (2.0) and $8.91 (2.272).
The thesis is not that those levels are imminent, but that the convexity of a potential “wave 3” is what makes the current pullback, if it holds the corrective framing, attractive from a risk/reward standpoint.
Notably, the AMD comparison is not the only cross-market framing Cantonese Cat has used recently. The analyst has also drawn parallels between Dogecoin and silver, according to our recent coverage, extending the same core idea across different assets: periods that feel uninteresting or unpopular can be precisely when the setup becomes more asymmetric.
At press time, DOGE traded at $0.12.
Related Articles

Bitcoin Bears Eye Lower Levels As TradingView Analysts Flag Failed Recovery
TradingView analysts warn Bitcoin's rebound may still be a resistance retest as...

Bitcoin Reclaims $63,500 As Traders Watch For Squeeze Toward $67,000
Bitcoin bulls are watching the $63,500 support zone as traders map a potential s...

Bitcoin Analysts Split Between Buyer Demand And Resistance Ceiling Near $65,000
Bitcoin analysts are split as BTC shows buyer demand but still faces a resistanc...

Bitcoin Faces Key $64,100 Resistance As Analyst Watches Fib Reaction Zone
An X analyst says Bitcoin is approaching local H4 resistance near $64,100, a lev...