Ethereum Dives Below $2,880 as Bears Tighten Their Grip on the Trend
Alex Smith
6 months ago

Ethereum price started a fresh decline below $2,950. ETH is down over 5%, trading below $2,880, and might continue to move down.
- Ethereum started a fresh decline below $2,950 and $2,900.
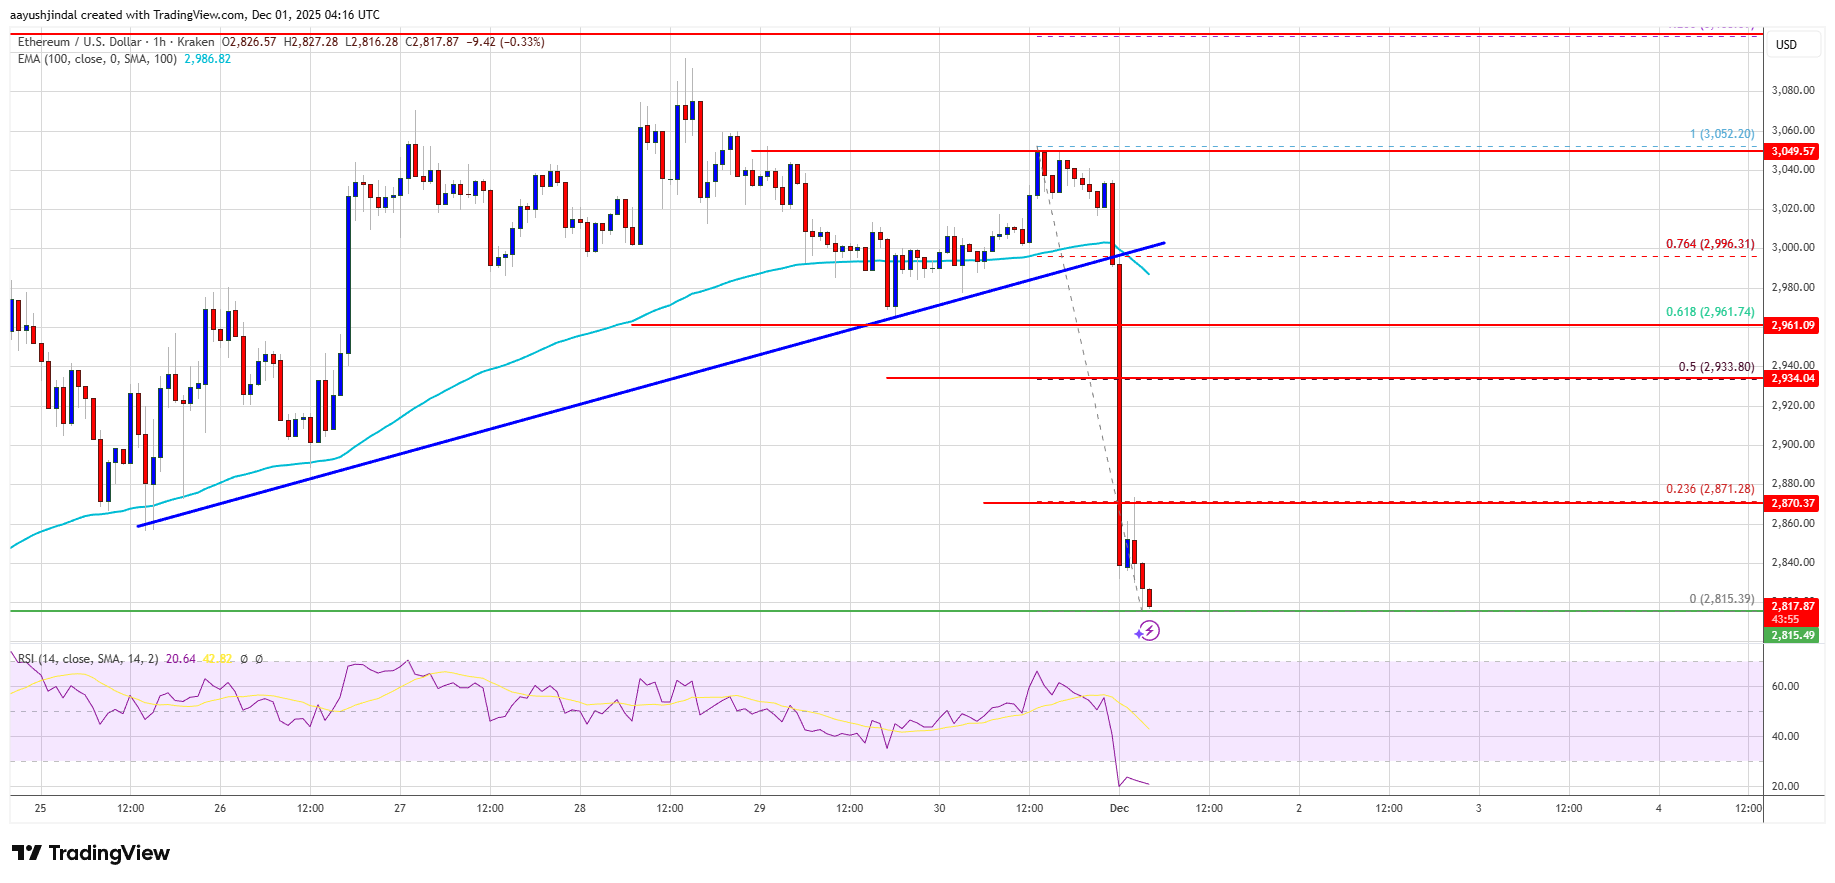
- The price is trading below $2,880 and the 100-hourly Simple Moving Average.
- There was a break below a key bullish trend line with support at $2,990 on the hourly chart of ETH/USD (data feed via Kraken).
- The pair could continue to move down if it settles below the $2,800 zone.
Ethereum Price Dips Over 5%
Ethereum price failed to stay above $3,000 and started a fresh decline, like Bitcoin. ETH price declined below $2,880 to enter a bearish zone.
There was a break below a key bullish trend line with support at $2,990 on the hourly chart of ETH/USD. The bears even pushed the price below $2,850. A low was formed at $2,815 and the price is showing bearish signs below the 23.6% Fib retracement level of the downward move from the $3,052 swing high to the $2,815 low.
Ethereum price is now trading below $2,900 and the 100-hourly Simple Moving Average. If there is another upward move, the price could face resistance near the $2,880 level.
The next key resistance is near the $2,940 level or the 50% Fib retracement level of the downward move from the $3,052 swing high to the $2,815 low. The first major resistance is near the $2,960 level. A clear move above the $2,960 resistance might send the price toward the $3,000 resistance. An upside break above the $3,000 region might call for more gains in the coming days. In the stated case, Ether could rise toward the $3,050 resistance zone or even $3,150 in the near term.
More Losses In ETH?
If Ethereum fails to clear the $2,960 resistance, it could start a fresh decline. Initial support on the downside is near the $2,820 level. The first major support sits near the $2,800 zone.
A clear move below the $2,800 support might push the price toward the $2,740 support. Any more losses might send the price toward the $2,720 region in the near term. The next key support sits at $2,650 and $2,620.
Technical Indicators
Hourly MACD – The MACD for ETH/USD is gaining momentum in the bearish zone.
Hourly RSI – The RSI for ETH/USD is now below the 50 zone.
Major Support Level – $2,800
Major Resistance Level – $2,940
Related Articles

Bitcoin Bears Eye Lower Levels As TradingView Analysts Flag Failed Recovery
TradingView analysts warn Bitcoin's rebound may still be a resistance retest as...

Bitcoin Reclaims $63,500 As Traders Watch For Squeeze Toward $67,000
Bitcoin bulls are watching the $63,500 support zone as traders map a potential s...

Bitcoin Analysts Split Between Buyer Demand And Resistance Ceiling Near $65,000
Bitcoin analysts are split as BTC shows buyer demand but still faces a resistanc...

Bitcoin Faces Key $64,100 Resistance As Analyst Watches Fib Reaction Zone
An X analyst says Bitcoin is approaching local H4 resistance near $64,100, a lev...