Ethereum Price Anchors At $1,920 — Can Bulls Ignite A Fresh Upside Leg?
Alex Smith
4 months ago
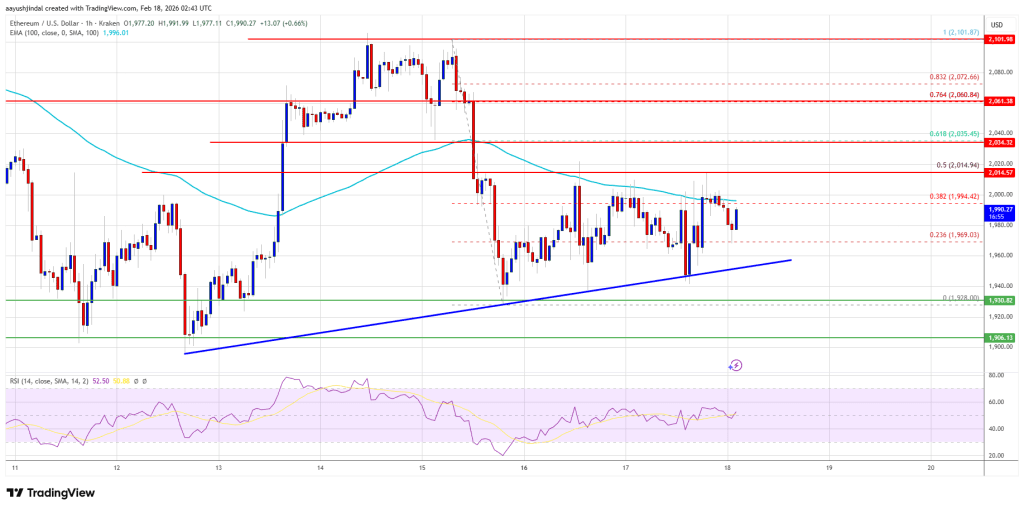
Ethereum price found support near $1,920 and recovered some losses. ETH is now consolidating and faces key hurdles near $2,020.
- Ethereum is attempting a fresh recovery wave above $1,965.
- The price is trading below $2,000 and the 100-hourly Simple Moving Average.
- There is a bullish trend line forming with support at $1,955 on the hourly chart of ETH/USD (data feed via Kraken).
- The pair could start a fresh decline if it stays below the $2,020 zone.
Ethereum Price Holds Support
Ethereum price failed to stay above $2,020 and started a fresh decline, like Bitcoin. ETH price traded below the $1,965 and $1,950 levels to enter a bearish zone.
Finally, the bulls appeared near $1,925. A low was formed at $1,928, and the price started a recovery wave. There was a move above the $1,965 resistance. The price even tested the 50% Fib retracement level of the downward move from the $2,100 swing high to the $1,928 low.
Ethereum price is now trading below $2,000 and the 100-hourly Simple Moving Average. Besides, there is a bullish trend line forming with support at $1,955 on the hourly chart of ETH/USD.
If the bulls remain in action above $1,955, the price could attempt another increase. Immediate resistance is seen near the $2,015 level. The first key resistance is near the $2,035 level or the 61.8% Fib retracement level of the downward move from the $2,100 swing high to the $1,928 low.
The next major resistance is near the $2,060 level. A clear move above the $2,060 resistance might send the price toward the $2,100 resistance. An upside break above the $2,100 region might call for more gains in the coming days. In the stated case, Ether could rise toward the $2,150 resistance zone or even $2,185 in the near term.
Another Decline In ETH?
If Ethereum fails to clear the $2,015 resistance, it could start a fresh decline. Initial support on the downside is near the $1,965 level. The first major support sits near the $1,955 zone or the trend line.
A clear move below the $1,955 support might push the price toward the $1,920 support. Any more losses might send the price toward the $1,880 region. The main support could be $1,825.
Technical Indicators
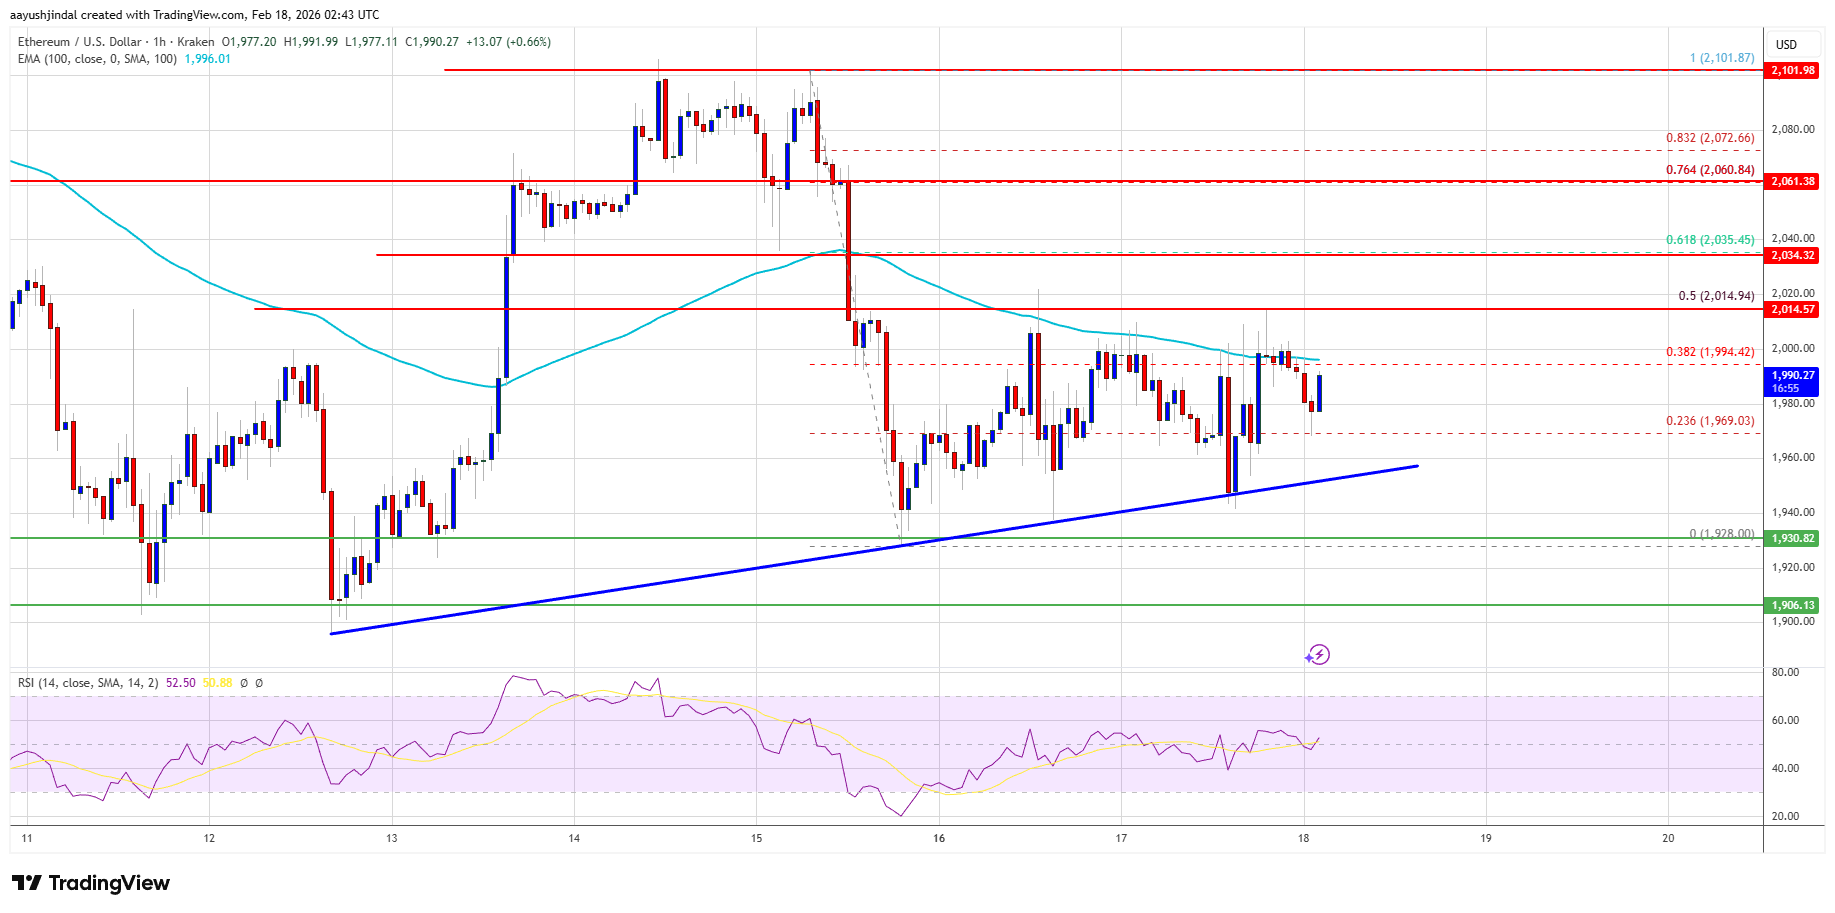
Hourly MACD – The MACD for ETH/USD is gaining momentum in the bullish zone.
Hourly RSI – The RSI for ETH/USD is now above the 50 zone.
Major Support Level – $1,920
Major Resistance Level – $2,015
Related Articles

Bitcoin Bears Eye Lower Levels As TradingView Analysts Flag Failed Recovery
TradingView analysts warn Bitcoin's rebound may still be a resistance retest as...

Bitcoin Reclaims $63,500 As Traders Watch For Squeeze Toward $67,000
Bitcoin bulls are watching the $63,500 support zone as traders map a potential s...

Bitcoin Analysts Split Between Buyer Demand And Resistance Ceiling Near $65,000
Bitcoin analysts are split as BTC shows buyer demand but still faces a resistanc...

Bitcoin Faces Key $64,100 Resistance As Analyst Watches Fib Reaction Zone
An X analyst says Bitcoin is approaching local H4 resistance near $64,100, a lev...