Ethereum Price Eyes Breakout Move, Traders Watch Key Resistance Closely
Alex Smith
1 month ago
Ethereum price started a recovery wave above the $2,120 zone. ETH is now consolidating and might rally if there is a clear move above the $2,150 resistance.
- Ethereum started a recovery wave above the $2,125 zone.
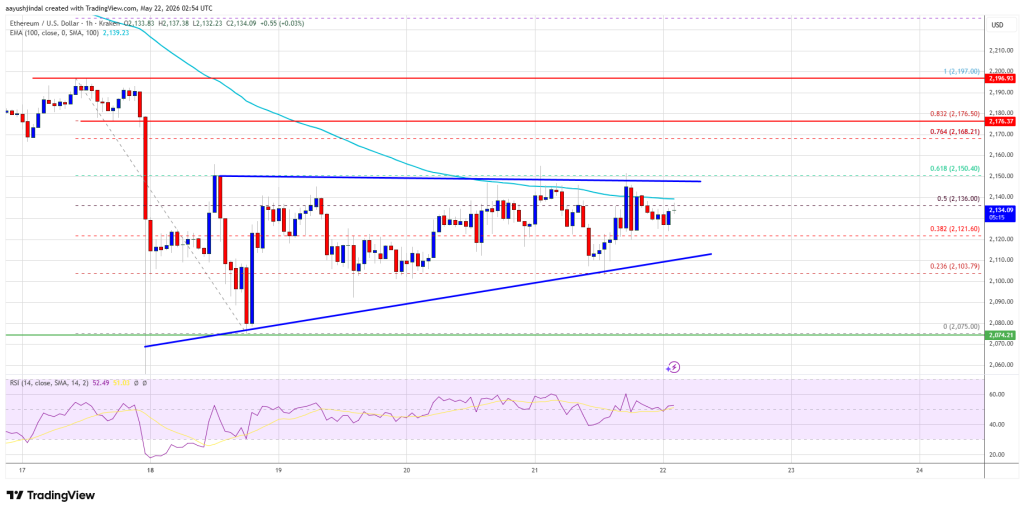
- The price is trading below $2,150 and the 100-hourly Simple Moving Average.
- There is a contracting triangle forming with resistance at $2,150 on the hourly chart of ETH/USD (data feed via Kraken).
- The pair could start a fresh decline if it stays below the $2,150 zone.
Ethereum Price Aims for Upside Break
Ethereum price remained bid above the $2,080 support zone, like Bitcoin. ETH price formed a base and started a recovery wave above the $2,100 resistance.
The price surpassed the 50% Fib retracement level of the downward move from the $2,197 swing high to the $2,075 swing low. However, the bears are active near $2,150. There is also a contracting triangle forming with resistance at $2,150 on the hourly chart of ETH/USD.
Ethereum price is now trading below $2,140 and the 100-hourly Simple Moving Average. If the bulls remain in action above $2,110, the price could attempt another increase. Immediate resistance is seen near the $2,140 level. The first key resistance is near the $2,150 level or the 61.8% Fib retracement level of the downward move from the $2,197 swing high to the $2,075 swing low.
The next major resistance is near the $2,176 level. A clear move above the $2,176 resistance might send the price toward the $2,220 resistance. An upside break above the $2,220 region might call for more gains in the coming days. In the stated case, Ether could rise toward the $2,265 resistance zone or even $2,320 in the near term.
Another Drop In ETH?
If Ethereum fails to clear the $2,150 resistance, it could start a fresh decline. Initial support on the downside is near the $2,110 level. The first major support sits near the $2,065 zone.
A clear move below the $2,065 support might push the price toward the $2,020 support. Any more losses might send the price toward the $2,000 region. The main support could be $1,940.
Technical Indicators
Hourly MACD – The MACD for ETH/USD is losing momentum in the bullish zone.
Hourly RSI – The RSI for ETH/USD is now above the 50 zone.
Major Support Level – $2,020
Major Resistance Level – $2,150
Related Articles

Bitcoin Bears Eye Lower Levels As TradingView Analysts Flag Failed Recovery
TradingView analysts warn Bitcoin's rebound may still be a resistance retest as...

Bitcoin Reclaims $63,500 As Traders Watch For Squeeze Toward $67,000
Bitcoin bulls are watching the $63,500 support zone as traders map a potential s...

Bitcoin Analysts Split Between Buyer Demand And Resistance Ceiling Near $65,000
Bitcoin analysts are split as BTC shows buyer demand but still faces a resistanc...

Bitcoin Faces Key $64,100 Resistance As Analyst Watches Fib Reaction Zone
An X analyst says Bitcoin is approaching local H4 resistance near $64,100, a lev...