Ethereum Price Struggles To Hold Strength, Downside Risks Build
Alex Smith
1 month ago

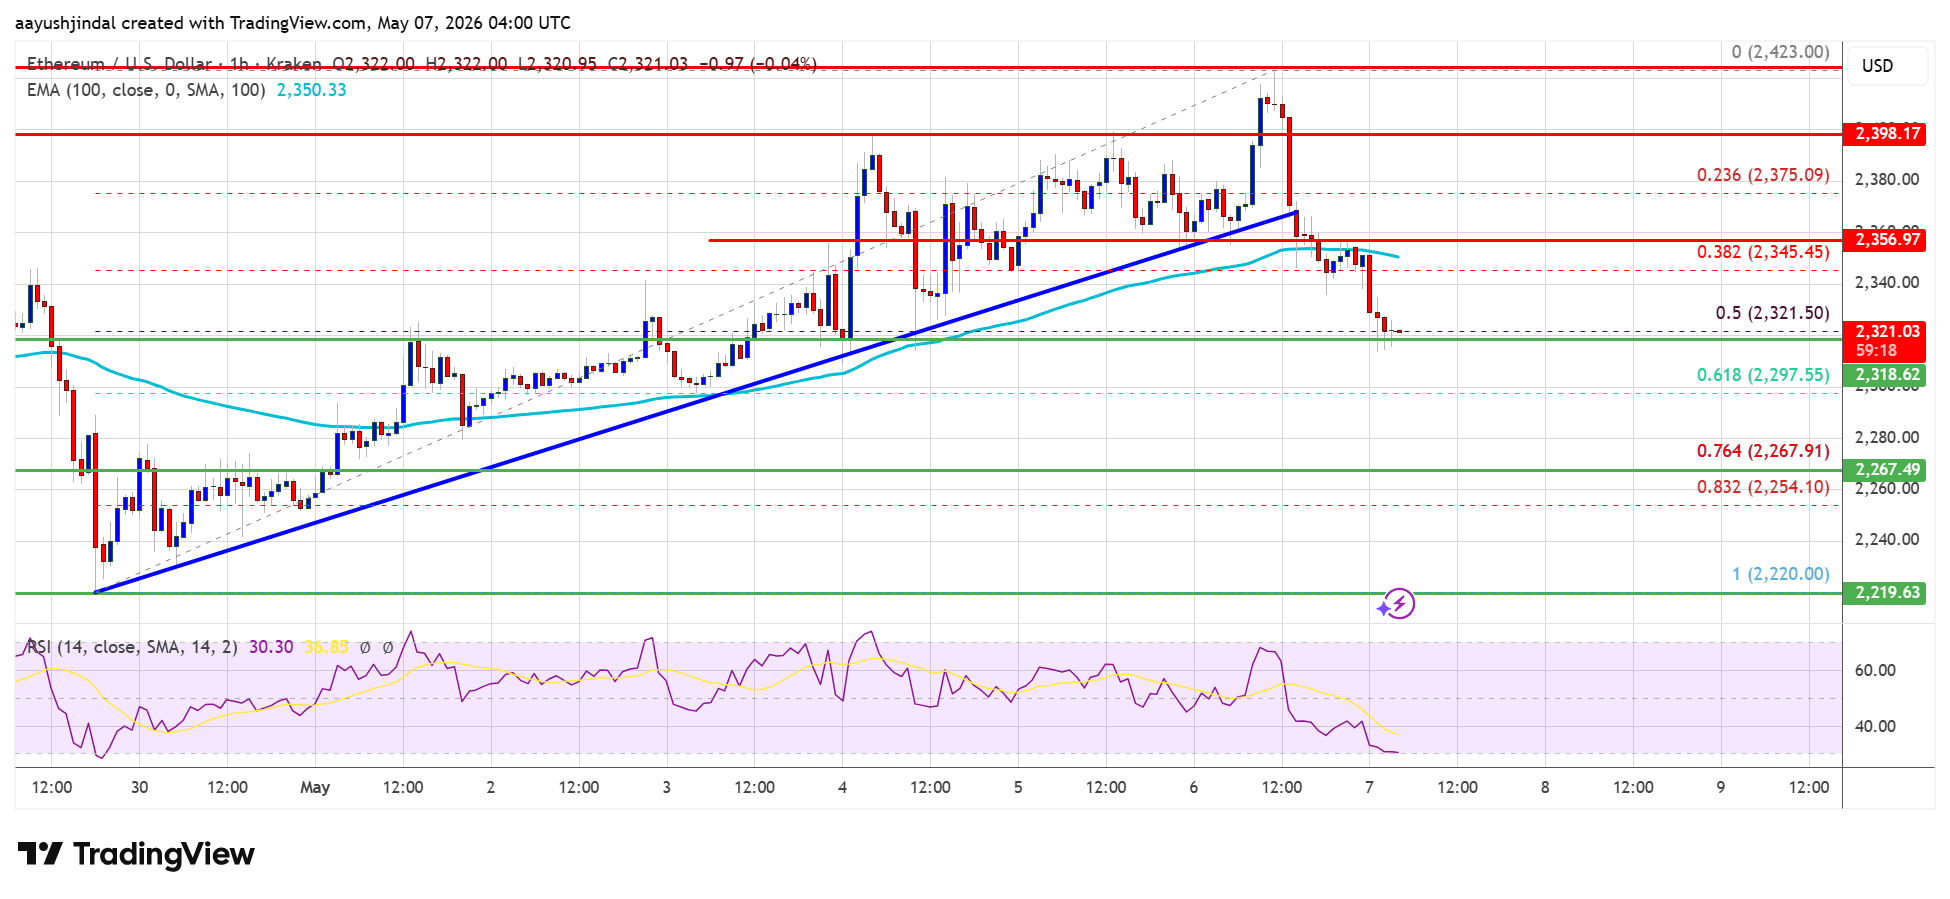
Ethereum price started a fresh increase and remained stable above $2,380. ETH is now correcting gains and might decline if it trades below $2,300.
- Ethereum started a downside correction from the $2,420 zone.
- The price is trading below $2,350 and the 100-hourly Simple Moving Average.
- There was a break below a bullish trend line with support at $2,365 on the hourly chart of ETH/USD (data feed via Kraken).
- The pair could continue to move down if it stays below the $2,365 zone.
Ethereum Price Trims Gains
Ethereum price managed to stay above the $2,320 support and started a fresh increase, like Bitcoin. ETH price gained pace for a move above $2,380 and $2,385.
However, the bears were active near $2,420. The last swing high was formed at $2,423 before there was a downside correction. The price dipped below the $2,365 level. Besides, there was a break below a bullish trend line with support at $2,365 on the hourly chart of ETH/USD.
The price even tested the 50% Fib retracement level of the upward move from the $2,220 swing low to the $2,423 high. Ethereum price is now trading below $2,360 and the 100-hourly Simple Moving Average.
If the bulls remain in action above $2,300, the price could attempt another increase. Immediate resistance is seen near the $2,350 level. The first key resistance is near the $2,380 level. The next major resistance is near the $2,420 level. A clear move above the $2,420 resistance might send the price toward the $2,450 resistance. An upside break above the $2,450 region might call for more gains in the coming days. In the stated case, Ether could rise toward the $2,500 resistance zone or even $2,550 in the near term.
Another Decline In ETH?
If Ethereum fails to clear the $2,360 resistance, it could start a downside correction. Initial support on the downside is near the $2,320 level. The first major support sits near the $2,300 zone.
A clear move below the $2,300 support might push the price toward the $2,265 support or the 76.4% Fib retracement level of the upward move from the $2,220 swing low to the $2,423 high. Any more losses might send the price toward the $2,200 region. The main support could be $2,150.
Technical Indicators
Hourly MACD – The MACD for ETH/USD is losing momentum in the bullish zone.
Hourly RSI – The RSI for ETH/USD is now below the 50 zone.
Major Support Level – $2,300
Major Resistance Level – $2,360
Related Articles

Bitcoin Faces Key $64,100 Resistance As Analyst Watches Fib Reaction Zone
An X analyst says Bitcoin is approaching local H4 resistance near $64,100, a lev...

Bitcoin Cost-Of-Production Signal Raises Miner Stress Question As BTC Holds Support
An X post claimed Bitcoin is again trading below average cost of production, whi...

Bitcoin Traders Split As BTC Holds $60K–$63.7K Support While Bulls Eye $67K
TradingView analysts are split on Bitcoin after multiple June 20 charts framed B...

Bitcoin Derivatives Watch: Perps And Futures Stay In Focus As BTC Holds Decision Zone
A derivatives sheet posted on X tracked 24 BTC perps and futures contracts as an...