HBL Engineering Stock Forms Inverted Head and Shoulders Pattern Hinting At Near Term Bullish Reversal
Alex Smith
1 month ago

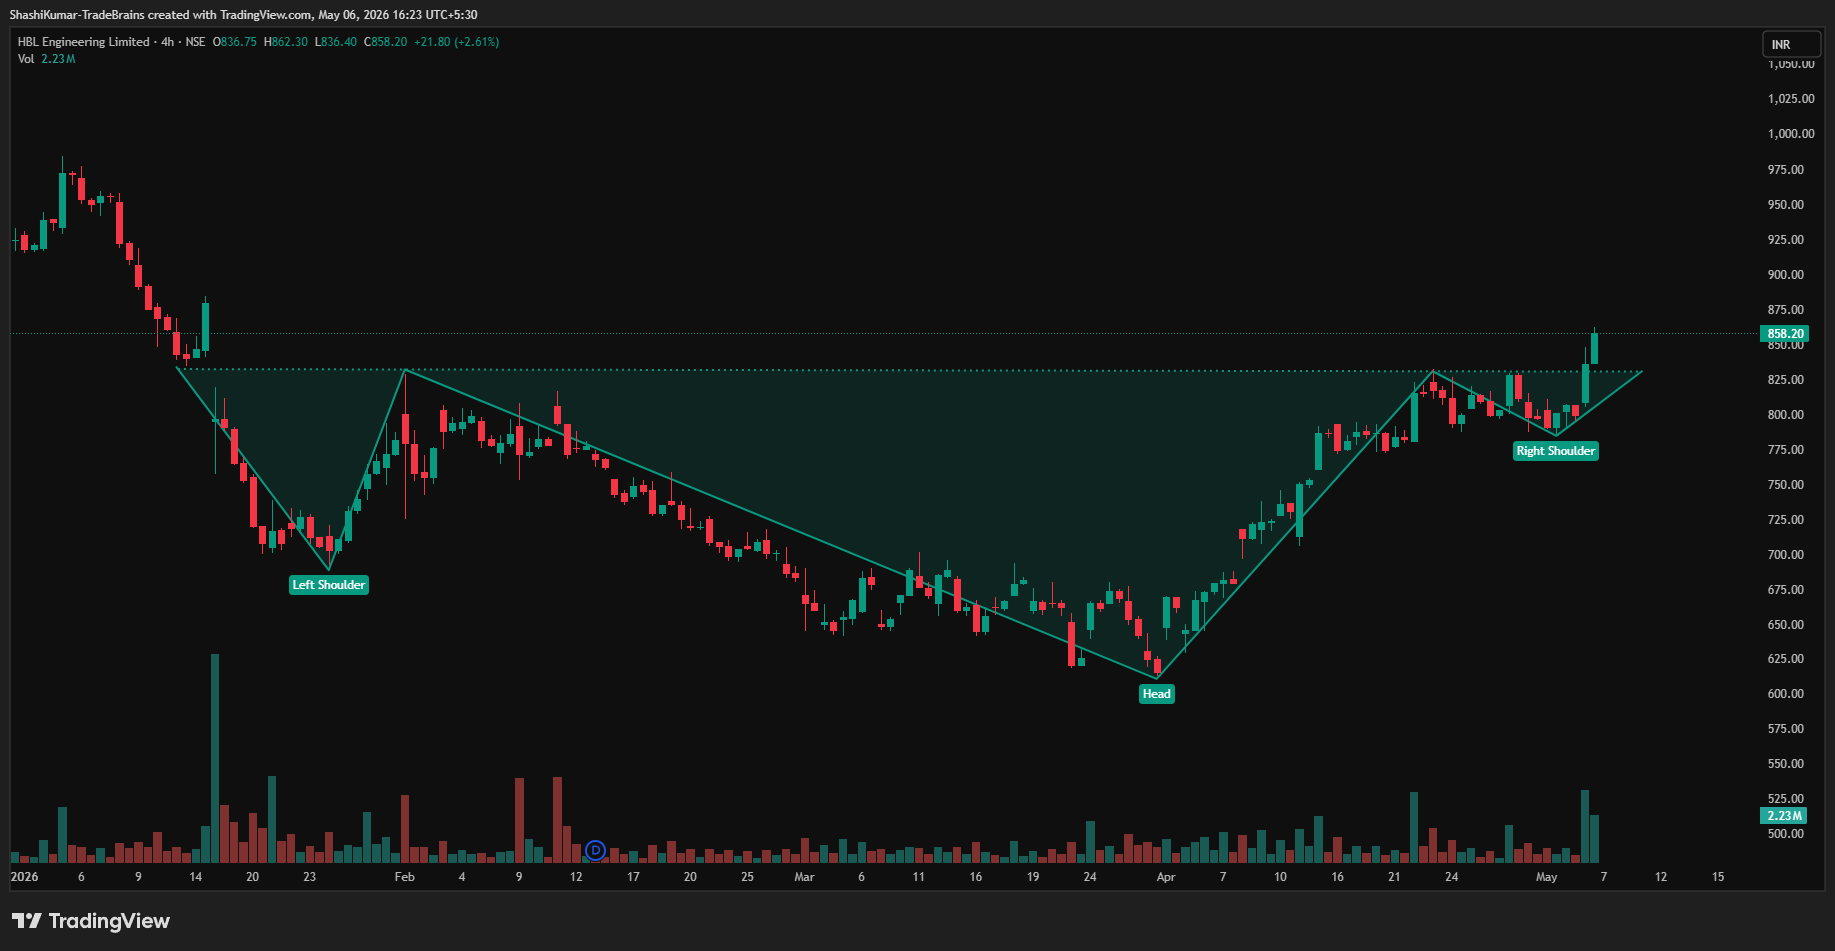
Synopsis:HBLENGINE has developed an inverse head-and-shoulders pattern on its 4-hour chart, indicating a potential near-term bullish reversal.
This pattern suggests that selling pressure is easing while buying interest is gradually strengthening. An inverted head-and-shoulders pattern consists of three troughs, with the middle one forming the lowest point (head) and the two outer troughs forming higher lows (shoulders).
On Wednesday, HBL Engineering Ltd broke the resistance neckline in the 4-hour chart and ended the session at Rs 858, up 3%. And the previous resistance level at Rs 832 now acts as a support zone. With any push in buying volumes, the price may move further upside; below this level weakens the bullish outlook.
Targets are generally set near resistance levels or by projecting the height from the head to the neckline upward. Traders often trail profits while monitoring volume and momentum for confirmation.
HBL Engineering Ltd Chart: 4-hour Timeframe
Indicator Confirmation
RSI: The daily RSI indicates bullish momentum, as it rose from 62.10 in the previous trading session to 71.51 on Wednesday.
MACD: On the daily time frame, the blue MACD line was above the orange signal line, with the histogram turning green, indicating bullish momentum.
Moving Averages: On the daily time frame, the 5-day EMA was above the 9-day EMA, further confirming a bullish trend.
Price Volume Trend: The Price Volume Indicator confirms the uptrend, accompanied by a sharp increase in buying volume in the daily time frame.
Implications
An inverted head-and-shoulders pattern signals a possible upward breakout. Sustaining above the Rs 832 support level, along with strong trading volumes, would strengthen the bullish outlook in the near term.
About the stock
Incorporated in 1986, HBL Engineering manufactures and services different types of batteries, e-mobility, and other products. The resulting businesses fall into three very different business segments. They are industrial batteries, defence, and industrial electronics.
HBL Engineering Ltd has gained 26.91% in the past month. Despite short-term gains, the stock has declined by 11.19% in the last six months, and on a year-over-year basis, it has delivered an impressive 79.63% return.
For more such technical stock ideas, click here to view our research page.
The post HBL Engineering Stock Forms Inverted Head and Shoulders Pattern Hinting At Near Term Bullish Reversal appeared first on Trade Brains.
Related Articles

Stock Held by BlackRock Targets ₹1.94 Lakh Crore AUM and 300% Profit Growth by FY30
Synopsis: Sammaan Capital is entering a new growth phase backed by IHC, focusing...

Aegis Vopak Shares: How a $5 Billion Expansion Plan Could Transform India’s Energy Logistics
Synopsis: A leading independent terminal operator posted FY26 revenue of Rs.923...

Asian Paints, HUL, and 6 Other Stocks Trading Ex-Dividend Next Week to Keep on Your Radar
Synopsis: Asian Paints, Hindustan Unilever, Indian Hotels, Tata Power, Nippon Li...
5 Market Favourite Stocks That Crashed Up to 62% but Have the Potential to Make a Comeback
Synopsis: Several market favorites that delivered exceptional returns during the...