Kalshi, Polymarket Combine for $17.9B February Volume as Polymarket Closes Gap
Alex Smith
4 months ago
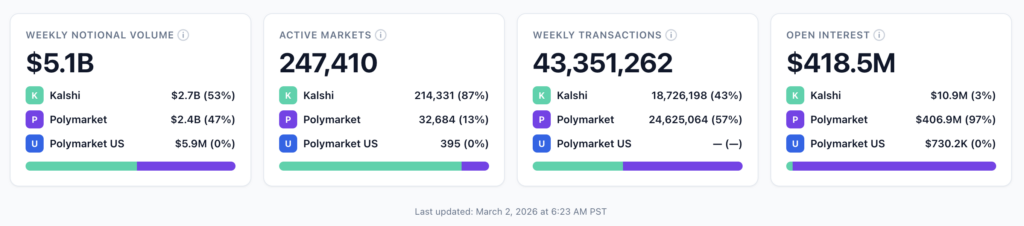
Total notional volume across tracked prediction exchanges rebounded to $5.80 billion for the week of Feb. 23–March 1, a 10.4% gain from the $5.25 billion posted the prior week. The headline jump tells part of the story but the internals tell the rest. Polymarket surged 31.9% to $2.40 billion — its largest weekly showing since Jan. 26–Feb. 1 — while Kalshi posted a more steady 5.4% gain to $2.73 billion.
DeFi Rate’s prediction market tracker, which aggregates live data across platforms, recorded 44.4 million transactions for the week across Kalshi and Polymarket, with Polymarket accounting for 24.6 million of them, a notable lead over Kalshi’s 18.7 million.
Two catalysts drove the week. Trump’s State of the Union address on Feb. 24 generated more than $17 million in combined mention volume across both platforms. Then, U.S. and Israeli strikes on Iran on Feb. 28, and the subsequent Khamenei market controversy, sent geopolitical trading into overdrive in the final days of the reporting period.
February closed at $22.3 billion in total notional volume across all tracked platforms, the second-highest month on record and the first monthly decline since August 2025.
Chart M1 *,*::before,*::after{box-sizing:border-box;margin:0;padding:0} .dr-wrap{background:#ffffff;border:1px solid #e2e8f0;border-radius:8px;padding:24px 24px 16px;font-family:Inter,-apple-system,sans-serif;max-width:720px;margin:0 auto} .dr-title{font-size:15px;font-weight:600;color:#0f172a;margin-bottom:4px} .dr-sub{font-size:12px;color:#64748b;margin-bottom:20px} .dr-metrics{display:flex;flex-wrap:wrap;gap:12px;margin-top:18px;padding-top:16px;border-top:1px solid #e2e8f0} .dr-metric{flex:1;min-width:110px} .dr-mlabel{font-size:10px;color:#64748b;text-transform:uppercase;letter-spacing:.6px;margin-bottom:3px} .dr-mval{font-size:16px;font-weight:700;color:#0f172a} .dr-mchg{font-size:11px;margin-top:1px} .up{color:#00e59b}.down{color:#f87171}.pol{color:#6366f1} .dr-table-wrap{overflow-x:auto;margin-top:18px} .dr-table{width:100%;border-collapse:collapse;font-size:12px} .dr-table th{text-align:right;padding:6px 10px;color:#64748b;font-weight:500;border-bottom:1px solid #e2e8f0;white-space:nowrap} .dr-table th:first-child{text-align:left} .dr-table td{text-align:right;padding:7px 10px;color:#475569;border-bottom:1px solid #f1f5f9;white-space:nowrap} .dr-table td:first-child{text-align:left;color:#0f172a} .dr-source{text-align:center;margin-top:14px;font-size:11px;color:#475569} .dr-source a{color:#00d4aa;text-decoration:none} @media(max-width:480px){.dr-wrap{padding:16px 14px 12px}.dr-title{font-size:13px}.dr-mval{font-size:14px}} Prediction market monthly volume — Aug. 2025–Feb. 2026 All tracked platforms · Notional volume, USD billions Feb. 2026 total$22.3B−14.5% vs. Jan. 7-month cumulative$97.6BAug. 2025–Feb. 2026 Peak month$26.0BJanuary 2026 7-month growth11.1×vs. Aug. baseline MonthTotal volumeMoM change August 2025$2.01B— September 2025$4.54B+126.9% October 2025$9.35B+105.7% November 2025$14.43B+54.4% December 2025$18.94B+31.2% January 2026$26.04B+37.5% February 2026$22.27B−14.5% Source: DeFi Rate (function(){ var labels=["Aug.","Sep.","Oct.","Nov.","Dec.","Jan.","Feb."]; var volumes=[2.00,4.54,9.35,14.43,18.94,26.04,22.27]; var colors=volumes.map(function(v,i){return i===6?"#00d4aa":"#1e4d6b";}); function init(){ if(typeof Chart==="undefined"){setTimeout(init,100);return;} new Chart(document.getElementById("cM1").getContext("2d"),{ type:"bar", data:{labels:labels,datasets:[{label:"Monthly volume",data:volumes,backgroundColor:colors,borderRadius:4,borderSkipped:false}]}, options:{ responsive:true,maintainAspectRatio:true, plugins:{legend:{display:false},tooltip:{backgroundColor:"#1e293b",titleColor:"#94a3b8",bodyColor:"#e2e8f0",borderColor:"#334155",borderWidth:1,padding:12, callbacks:{label:function(c){return " Volume: $"+c.parsed.y.toFixed(2)+"B";}}}}, scales:{ x:{grid:{color:"#e2e8f0"},ticks:{color:"#64748b",font:{family:"Inter",size:11}}}, y:{min:0,max:30,grid:{color:"#e2e8f0"},ticks:{color:"#64748b",font:{family:"Inter",size:11},callback:function(v){return "$"+v+"B";}}} } } }); } document.readyState==="complete"?init():window.addEventListener("load",init); })();*Note: Industry data totals only include platforms currently tracked by Dune.
Despite the overall tracked platform decline, both Kalshi and Polymarket posted mild MoM increases over January:
- Kalshi: $9.93 billion in February (+3.9% MoM)
- Polymarket: $7.94 billion in February (+3.7% MoM)
Kalshi vs. Polymarket: The gap narrows to its tightest in six weeks
The Polymarket surge didn’t just move the weekly total; it also fundamentally compressed the competitive dynamic between the two top platforms. Kalshi’s share of combined K+P volume fell from 58.7% the prior week to 53.2% this week, the tightest it has been in the six-week tracking window.
Chart 1 *,*::before,*::after{box-sizing:border-box;margin:0;padding:0} .dr-wrap{background:#ffffff;border:1px solid #e2e8f0;border-radius:8px;padding:24px 24px 16px;font-family:'Inter',-apple-system,sans-serif;max-width:720px;margin:0 auto} .dr-title{font-size:15px;font-weight:600;color:#0f172a;margin-bottom:4px} .dr-sub{font-size:12px;color:#64748b;margin-bottom:16px} .dr-legend{display:flex;gap:20px;margin-bottom:16px;flex-wrap:wrap} .dr-leg-item{display:flex;align-items:center;gap:7px;font-size:12px;color:#475569} .dr-swatch{width:12px;height:12px;border-radius:2px} .dr-metrics{display:flex;flex-wrap:wrap;gap:12px;margin-top:18px;padding-top:16px;border-top:1px solid #e2e8f0} .dr-metric{flex:1;min-width:110px} .dr-mlabel{font-size:10px;color:#64748b;text-transform:uppercase;letter-spacing:.6px;margin-bottom:3px} .dr-mval{font-size:16px;font-weight:700;color:#0f172a} .dr-mchg{font-size:11px;margin-top:1px} .up{color:#00e59b}.down{color:#f87171}.kal{color:#00d4aa!important}.pol{color:#6366f1!important} .dr-table-wrap{overflow-x:auto;margin-top:18px} .dr-table{width:100%;border-collapse:collapse;font-size:12px} .dr-table th{text-align:right;padding:6px 10px;color:#64748b;font-weight:500;border-bottom:1px solid #e2e8f0;white-space:nowrap} .dr-table th:first-child{text-align:left} .dr-table td{text-align:right;padding:7px 10px;color:#475569;border-bottom:1px solid #f1f5f9;white-space:nowrap} .dr-table td:first-child{text-align:left;color:#0f172a} .dr-table tr:last-child td{border-bottom:none} .dr-source{text-align:center;margin-top:14px;font-size:11px;color:#475569} .dr-source a{color:#00d4aa;text-decoration:none} @media(max-width:480px){.dr-wrap{padding:16px 14px 12px}.dr-title{font-size:13px}.dr-mval{font-size:14px}} Kalshi vs. Polymarket weekly volume — 6-week trend Jan. 19–March 1, 2026 · Notional volume, USD billions Kalshi Polymarket Kalshi this week$2.73B+5.4% WoW Polymarket this week$2.40B+31.9% WoW K+P combined$5.13B+16.3% WoW Kalshi share47.1%vs. 58.7% prior wk Week ofKalshiPolymarketK+P totalK share of K+P Jan. 19$2.26B$1.76B$4.01B56.2% Jan. 26$2.20B$2.08B$4.28B51.3% Feb. 2$2.80B$1.92B$4.71B59.4% Feb. 9$2.43B$1.88B$4.31B56.3% Feb. 16$2.59B$1.82B$4.41B58.7% Feb. 23$2.73B$2.40B$5.13B53.2% Source: DeFi Rate (function(){ var labels=['Jan. 19','Jan. 26','Feb. 2','Feb. 9','Feb. 16','Feb. 23']; var kalshi=[2.26,2.20,2.80,2.43,2.59,2.73]; var poly=[1.76,2.08,1.92,1.88,1.82,2.40]; function init(){ if(typeof Chart==='undefined'){setTimeout(init,100);return;} new Chart(document.getElementById('c1').getContext('2d'),{ type:'bar', data:{ labels:labels, datasets:[ {label:'Kalshi',data:kalshi,backgroundColor:'#00d4aa',borderRadius:3,borderSkipped:false}, {label:'Polymarket',data:poly,backgroundColor:'#6366f1',borderRadius:3,borderSkipped:false} ] }, options:{ responsive:true,maintainAspectRatio:true, interaction:{mode:'index',intersect:false}, plugins:{ legend:{display:false}, tooltip:{backgroundColor:'#1e293b',titleColor:'#94a3b8',bodyColor:'#e2e8f0',borderColor:'#334155',borderWidth:1,padding:12, callbacks:{label:function(c){return ' '+c.dataset.label+': $'+c.parsed.y.toFixed(2)+'B';}}} }, scales:{ x:{grid:{color:'#e2e8f0'},ticks:{color:'#64748b',font:{family:'Inter',size:11}}}, y:{min:0,max:3.2,grid:{color:'#e2e8f0'},ticks:{color:'#64748b',font:{family:'Inter',size:11},callback:function(v){return '$'+v.toFixed(1)+'B';}}} } } }); } document.readyState==='complete'?init():window.addEventListener('load',init); })();That marks a meaningful reversal. From Feb. 2 through Feb. 22, Kalshi held an average share of 58.1% of combined volume, buoyed by its sports dominance through and after the Super Bowl. This week, Polymarket added $580 million in absolute volume WoW. Kalshi added roughly $139 million. The result is a gap of $329 million that is less than half the $770 million spread from the prior week.
Whether this week marks a structural shift or a one-week event spike is the key question heading into March. SOTU and Iran contracts are episodic, but primary season and monthly FOMC decisions could help sustain Polymarket’s non-sports advantage.
Polymarket’s 32% surge
The magnitude of Polymarket’s weekly gain traces to an unusual collision of political and geopolitical catalysts.
The first was the State of the Union. Kalshi and Polymarket combined for more than $17 million just in SOTU-specific “What will Trump say” mention market volume, with Kalshi’s market drawing $11.97 million in volume. Mention markets convert casual viewers into active traders at scale, and Tuesday night’s speech delivered proof of concept at eight-figure volume.
The second catalyst was harder to anticipate. U.S. and Israeli strikes on Iran on Feb. 28, and the subsequent confirmation of Ayatollah Khamenei’s death, triggered a surge in geopolitical trading on both platforms on the final day of the month (Saturday). Polymarket’s Iran-related contracts — operating outside U.S. CFTC jurisdiction — accumulated over $200 million in volume across four markets, according to our reporting on the Kalshi and Polymarket Khamenei market dispute. Kalshi’s equivalent “out of office” contract saw more than $54.5 million in volume before trading was halted Saturday afternoon and positions were settled at the last traded price before death. The Saturday morning military strike, in particular, accounted for a significant share of Polymarket’s $580 million WoW volume gain.
Kalshi vs. Polymarket category breakdown
Meanwhile, the category breakdown across Kalshi and Polymarket continues to show differentiation between the two platforms. A whopping 76.1% of Kalshi’s $2.73 billion volume last week came from Sports. Only 34.5% of Polymarket’s $2.40 billion was driven by Sports. That 41.6 percentage points gap is the defining structural contrast between the two platforms right now.
Chart 2 — Kalshi vs. Polymarket Category Breakdown *,*::before,*::after{box-sizing:border-box;margin:0;padding:0} .dr-wrap{background:#ffffff;border:1px solid #e2e8f0;border-radius:8px;padding:24px 24px 16px;font-family:Inter,-apple-system,sans-serif;max-width:720px;margin:0 auto} .dr-title{font-size:15px;font-weight:600;color:#0f172a;margin-bottom:4px} .dr-sub{font-size:12px;color:#64748b;margin-bottom:16px} .dr-legend{display:flex;gap:20px;margin-bottom:16px;flex-wrap:wrap} .dr-leg-item{display:flex;align-items:center;gap:7px;font-size:12px;color:#475569} .dr-swatch{width:12px;height:12px;border-radius:2px;flex-shrink:0} .dr-note{font-size:11px;color:#64748b;margin-top:10px;font-style:italic} .dr-metrics{display:flex;flex-wrap:wrap;gap:12px;margin-top:18px;padding-top:16px;border-top:1px solid #e2e8f0} .dr-metric{flex:1;min-width:130px} .dr-mlabel{font-size:10px;color:#64748b;text-transform:uppercase;letter-spacing:.6px;margin-bottom:3px} .dr-mval{font-size:15px;font-weight:700;color:#0f172a} .dr-mchg{font-size:11px;margin-top:1px;color:#475569} .dr-table-wrap{overflow-x:auto;margin-top:18px} .dr-table{width:100%;border-collapse:collapse;font-size:12px} .dr-table th{text-align:right;padding:6px 10px;color:#64748b;font-weight:500;border-bottom:1px solid #e2e8f0;white-space:nowrap} .dr-table th:first-child{text-align:left} .dr-table td{text-align:right;padding:7px 10px;color:#475569;border-bottom:1px solid #f1f5f9;white-space:nowrap} .dr-table td:first-child{text-align:left;color:#0f172a} .dr-table tr:last-child td{border-bottom:none} .dr-source{text-align:center;margin-top:14px;font-size:11px;color:#94a3b8} .dr-source a{color:#00d4aa;text-decoration:none} .kal{color:#00d4aa!important}.pol{color:#6366f1!important} @media(max-width:480px){.dr-wrap{padding:16px 14px 12px}.dr-title{font-size:13px}.dr-mval{font-size:13px}} Kalshi vs. Polymarket — category breakdown, week of Feb. 23 Share of each platform’s total weekly volume by category · Kalshi $2.73B total · Polymarket $2.40B total Kalshi Polymarket *Polymarket Politics includes Trump category ($116.3M). Kalshi Exotics has no direct Polymarket equivalent. Kalshi sports concentration 76.1% $2.08B of $2.73B total Polymarket sports concentration 34.5% $827M of $2.40B total Poly politics + crypto 62.2% vs. 13.4% on Kalshi Kalshi non-sports 23.9% $651M across 14 categories Category Kalshi volume Kalshi % Polymarket volume Polymarket % Sports$2,078.4M76.1%$827.5M34.5% Crypto$250.7M9.2%$709.7M29.6% Politics*$115.5M4.2%$783.0M32.6% Exotics$152.3M5.6%—— Economy / Economics$12.0M0.4%$24.2M1.0% Entertainment / Culture$19.3M0.7%$27.0M1.1% Mentions$23.4M0.9%—— Other$77.7M2.9%$29.1M1.2% Source: DeFi Rate · *Polymarket Politics includes Trump category (function(){ // Categories ordered by visual impact — sports first, then show the contrast var cats = ["Sports","Crypto","Politics*","Exotics (K only)","Entertainment/Culture","Mentions (K only)","Economy"]; var kalshi = [76.1, 9.2, 4.2, 5.6, 0.7, 0.9, 0.4]; var poly = [34.5, 29.6, 32.6, 0, 1.1, 0, 1.0]; function init(){ if(typeof Chart==="undefined"){setTimeout(init,100);return;} new Chart(document.getElementById("c2").getContext("2d"),{ type:"bar", data:{ labels:cats, datasets:[ {label:"Kalshi",data:kalshi,backgroundColor:"#00d4aa",borderRadius:3,borderSkipped:false}, {label:"Polymarket",data:poly,backgroundColor:"#6366f1",borderRadius:3,borderSkipped:false} ] }, options:{ responsive:true, maintainAspectRatio:true, indexAxis:"y", interaction:{mode:"index",intersect:false}, plugins:{ legend:{display:false}, tooltip:{ backgroundColor:"#1e293b",titleColor:"#94a3b8",bodyColor:"#e2e8f0", borderColor:"#334155",borderWidth:1,padding:12, callbacks:{ label:function(c){ return " "+c.dataset.label+": "+c.parsed.x.toFixed(1)+"%"; } } } }, scales:{ x:{ min:0,max:85, grid:{color:"#e2e8f0"}, ticks:{color:"#64748b",font:{family:"Inter",size:11},callback:function(v){return v+"%";}} }, y:{ grid:{display:false}, ticks:{color:"#0f172a",font:{family:"Inter",size:12,weight:"500"}} } } } }); } document.readyState==="complete"?init():window.addEventListener("load",init); })();Polymarket’s big three: Sports (34.5%), Crypto (29.6%), and Politics including Trump markets (32.6%) account for 96.7% of all Polymarket volume. By contrast, Kalshi’s non-sports volume is spread across 14 categories, none of which individually breaks 10%.
The SOTU impact: Kalshi’s Politics category hit $115.5 million (4.2% of its total) and Polymarket’s combined Politics + Trump came in at $783.0 million (32.6%) last week. The mention market and attendance contract activity from Feb. 24 was a key driver of both spikes relative to prior weeks.
Kalshi’s Exotics ($152.3M, 5.6%), which has no direct Polymarket equivalent, is the second-largest non-sports category on Kalshi and worth watching as a differentiator heading into March Madness. While yet to obtain confirmation, this category likely includes markets like combos (AKA parlays), or complex trades beyond simple binary yes/no markets.
Mention markets on Kalshi logged $23.4 million (0.9%): While modest in isolation, mention markets are gaining in interest, especially around marquee events. If the category sustains that kind of per-event volume through primary season, it could become a structurally significant non-sports line.
Top markets to close out February
The State of the Union was a volume driver last week, but maybe even more importantly a headline driver. FOMC policy or fed rate markets also remained active across both platforms. With the next Fed decision scheduled for March 18–19, odds for no rate cut in March have been trading above 96% on both Kalshi and Polymarket, reflecting consistent cross-platform alignment on the near-term rate path.
Meanwhile, big NBA matchups and isolated soccer and college basketball games continue to carry Kalshi’s sports volume for the time being. And don’t underestimate the interest in golf, including one-off PGA events like the Cognizant Classic in The Palm Beaches that just wrapped on Sunday and drew an impressive $42.6 million total volume at Kalshi.
Iran geopolitical contracts closed the week as the highest-volume single-event cluster. Polymarket’s Iran-related contracts accumulated over $200 million across four markets in the 48 hours surrounding Feb. 28 and followed with more allegations of insider trading. Kalshi’s “Khamenei out” contract drew more than $50 million before trading was halted and positions settled at the last traded price before death — a resolution approach that reignited calls for more clear market criteria.
Full platform comparison: Week of Feb. 23
Kalshi and Polymarket’s gains came at the expense of the rest of the field. Opinion fell 40.0% to $362.5 million — its lowest weekly posting since early January — and predict.fun dropped 21.4% to $173.2 million. Both declines likely relate to the nature of the trading volume on these onchain platforms, which we have previously flagged likely contains an outsized amount of wash trading. The sports calendar thinning out between the Super Bowl and Selection Sunday could also be a contributing factor.
Here’s a look at the full prediction market platform volume comparison for the week of Feb. 23-March 1:
PlatformFeb. 23–March 1WoWShareKalshi$2.73B+5.4%47.1%Polymarket$2.40B+31.9%41.4%Opinion$362.5M−40.0%6.3%predict.fun$173.2M−21.4%3.0%Other*$127.9M—2.2%Total$5.80B+10.4%—*Other includes Limitless, Myriad, ForecastEx, and other tracked platforms. WoW comparison unreliable due to shifting composition of the Dune “Other” grouping.
February 2026 in context
February’s $22.3 billion volume represents a MoM decline of −14.5% but the calendar-adjusted number is more instructive, since February has 28 days and January has 31. On a per-day basis, February ran approximately $795 million versus January’s $840 million, for a −5.4% per-day decline that looks considerably less dramatic than the headline figure.
Chart M2 — February Platform Breakdown *,*::before,*::after{box-sizing:border-box;margin:0;padding:0} .dr-wrap{background:#ffffff;border:1px solid #e2e8f0;border-radius:8px;padding:24px 24px 16px;font-family:Inter,-apple-system,sans-serif;max-width:720px;margin:0 auto} .dr-title{font-size:15px;font-weight:600;color:#0f172a;margin-bottom:4px} .dr-sub{font-size:12px;color:#64748b;margin-bottom:20px} .dr-metrics{display:flex;flex-wrap:wrap;gap:12px;margin-top:18px;padding-top:16px;border-top:1px solid #e2e8f0} .dr-metric{flex:1;min-width:110px} .dr-mlabel{font-size:10px;color:#64748b;text-transform:uppercase;letter-spacing:.6px;margin-bottom:3px} .dr-mval{font-size:16px;font-weight:700;color:#0f172a} .dr-mchg{font-size:11px;margin-top:1px;color:#475569} .up{color:#00e59b} .dr-table-wrap{overflow-x:auto;margin-top:18px} .dr-table{width:100%;border-collapse:collapse;font-size:12px} .dr-table th{text-align:right;padding:6px 10px;color:#64748b;font-weight:500;border-bottom:1px solid #e2e8f0;white-space:nowrap} .dr-table th:first-child{text-align:left} .dr-table td{text-align:right;padding:7px 10px;color:#475569;border-bottom:1px solid #f1f5f9;white-space:nowrap} .dr-table td:first-child{text-align:left;color:#0f172a} .dr-table tr:last-child td{border-bottom:none;font-weight:600;color:#0f172a} .dr-source{text-align:center;margin-top:14px;font-size:11px;color:#475569} .dr-source a{color:#00d4aa;text-decoration:none} @media(max-width:480px){.dr-wrap{padding:16px 14px 12px}.dr-title{font-size:13px}.dr-mval{font-size:14px}} February 2026 volume by platform All tracked platforms · Total monthly notional volume: $22.3B Kalshi share44.6%$9.93B Polymarket share35.7%$7.94B Opinion share13.9%$3.11B K+P combined80.3%of Feb. total PlatformFeb. volumeShareFeb. transactions Kalshi$9,925.8M44.6%70.8M Polymarket$7,942.6M35.7%80.7M Opinion$3,106.7M13.9%1.3M predict.fun$784.0M3.5%747K Other*$514.5M2.3%2.2M Total$22,273.6M100%155.7M Source: DeFi Rate · *Other includes Overtime, Limitless, Myriad, ForecastEx (function(){ var labels=["Kalshi","Polymarket","Opinion","predict.fun","Other"]; var volumes=[9925.8,7942.6,3106.7,784.0,514.5]; var colors=["#00d4aa","#6366f1","#f59e0b","#64748b","#475569"]; function init(){ if(typeof Chart==="undefined"){setTimeout(init,100);return;} new Chart(document.getElementById("cM2").getContext("2d"),{ type:"bar", data:{ labels:labels, datasets:[{label:"February volume ($M)",data:volumes,backgroundColor:colors,borderRadius:4,borderSkipped:false}] }, options:{ responsive:true,maintainAspectRatio:true, indexAxis:"y", plugins:{legend:{display:false},tooltip:{backgroundColor:"#1e293b",titleColor:"#94a3b8",bodyColor:"#e2e8f0",borderColor:"#334155",borderWidth:1,padding:12, callbacks:{ label:function(c){ var b=c.parsed.x>=1000?"$"+(c.parsed.x/1000).toFixed(2)+"B":"$"+c.parsed.x.toFixed(0)+"M"; return " "+b; } } }}, scales:{ x:{grid:{color:"#e2e8f0"},ticks:{color:"#64748b",font:{family:"Inter",size:10},callback:function(v){return v>=1000?"$"+(v/1000).toFixed(0)+"B":"$"+v+"M";}}}, y:{grid:{display:false},ticks:{color:"#0f172a",font:{family:"Inter",size:12,weight:"500"}}} } } }); } document.readyState==="complete"?init():window.addEventListener("load",init); })();Other includes Overtime, Limitless, Myriad, ForecastEx, and other tracked platforms.
The February platform comparison has a couple key threads worth noting. First, Kalshi and Polymarket both grew MoM. Kalshi posted $9.93 billion (+3.9% vs. January), and Polymarket posted $7.94 billion (+3.7%). These two platforms, which now account for 80.3% of all tracked February volume, were net positive for the month by every measure.
The sub-narrative and the reason for the overall MoM decline comes from Opinion’s apparent volume collapse. Their $8.08 billion January figure, which was likely driven by inflated or artificial volume data, fell to $3.11 billion in February, a 61.5% decline. The February headline decline is essentially an Opinion story wrapped in aggregate numbers.
predict.fun, which shares ownership ties with Opinion, showed 37.2% MoM growth to $784.0 million — but we will continue to interpret these figures with caution.
One transaction-layer dynamic is worth flagging. Polymarket processed 80.7 million February transactions against Kalshi’s 70.8 million — the first time Polymarket has led Kalshi in monthly transaction count in the current tracking period. Kalshi leads on volume ($9.9B to $7.9B) while Polymarket leads on frequency. That divergence could indicate a structural difference worth monitoring: Kalshi appears to skew toward fewer, larger positions while Polymarket is showing more high-frequency, smaller-size trading.
What comes next: Trading events and trust issues
The week of March 2 opens with prediction markets at a clear inflection point — and not entirely for reasons the industry would have chosen.
The Khamenei episode immediately became one of the most scrutinized moments in prediction market history. Senators led by Adam Schiff have set a March 9 deadline for CFTC Chairman Michael Selig to respond to calls for a ban on contracts that resolve on or correlate to an individual’s death. Senator Chris Murphy has announced plans for legislation targeting markets he considers susceptible to insider exploitation. Rajiv Sethi’s analysis via Substack adds a wrinkle to that debate: even last-trade-price resolution doesn’t fully close the door on insider profit, because a well-positioned trader can drive prices before the event and still extract meaningful gain without a binary payout. The challenge isn’t just which contracts to allow. It’s whether any design can make these markets genuinely resistant to exploitation by people with advance knowledge of the outcome.
The regulatory pressure is no longer coming from one direction. Also on March 2, Mick Mulvaney — Trump’s former White House chief of staff — launched a coalition called Gambling Is Not Investing specifically targeting sports-based event contracts, arguing they bypass state gambling frameworks and consumer protections. Until now, most formal opposition has come from Democratic lawmakers. Mulvaney’s entry creates a bipartisan squeeze, and he told Bloomberg he plans to make the case directly to the Trump administration for “common sense regulation.” That’s worth watching for Kalshi in particular, given that sports represented 76.1% of its volume this week.
Whatever the CFTC response produces, it will shape not just geopolitical market design but the broader question of what event types can exist on regulated American exchanges. Markets attract institutional and retail capital because participants trust resolution. The industry’s long-term growth case is far stronger when that trust holds — and right now, it’s being tested in real time.
On the sports calendar, the immediate catalyst is Selection Sunday on March 15. March Madness trading is the next genuine volume event for prediction markets — 67 games, multiple round structures, and a built-in audience of casual traders who engage with bracket outcomes. NBA playoff positioning is entering its critical stretch, with standings-tightening driving game-by-game and season-futures volume over the next 6-8 weeks. Soccer is drawing increasing attention across both platforms, and with the 2026 World Cup on home soil, that interest is set to compound well before the tournament kicks off. Kalshi’s World Cup market liquidity is expected to build further as March Madness concludes.
Meanwhile, the 2026 midterm primary season is beginning to generate its first serious volume. Early primary contests and candidate filing deadlines are creating the initial political pipeline that will dominate non-sports prediction market activity through summer. Polymarket’s structural advantage in politics and macro — already evident in the transaction data — positions it well as that cycle accelerates. The combination of sports depth on Kalshi and political breadth on Polymarket may be exactly what keeps the market’s combined volume floor elevated until the next NFL season lifts the tides once again.
The post Kalshi, Polymarket Combine for $17.9B February Volume as Polymarket Closes Gap appeared first on DeFi Rate.
Related Articles
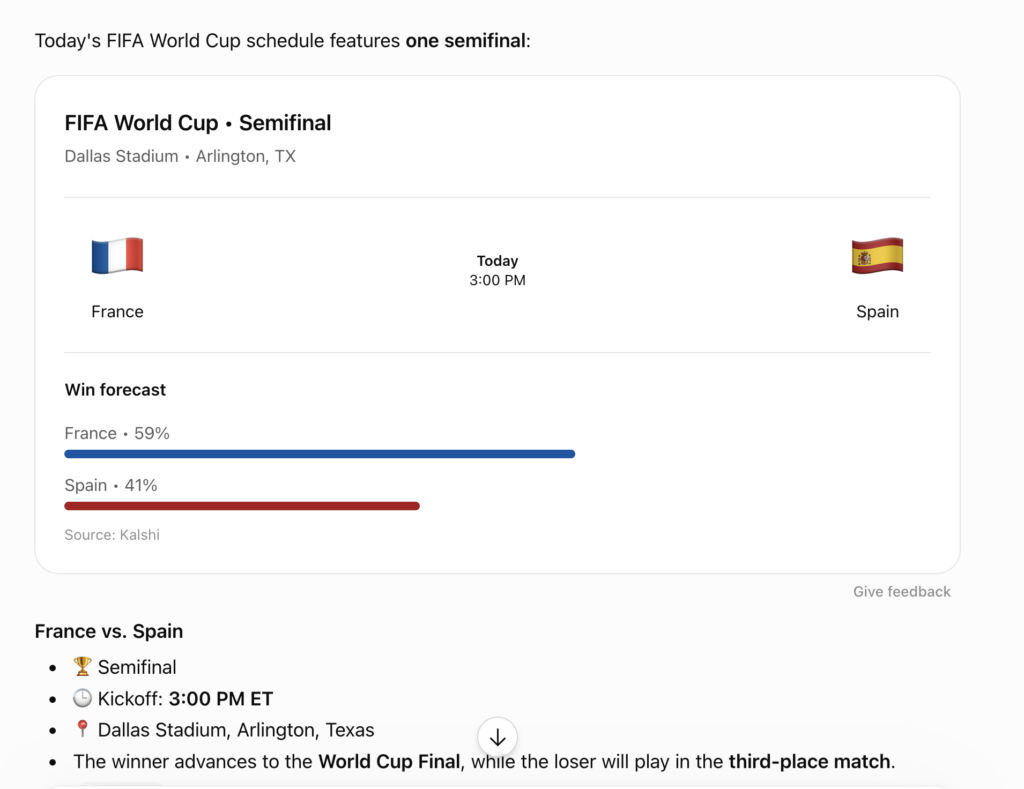
OpenAI Begins Showing Kalshi World Cup Odds in ChatGPT Search Results
The integration, first reported by The New York Times, adds Kalshi-sourced win f...
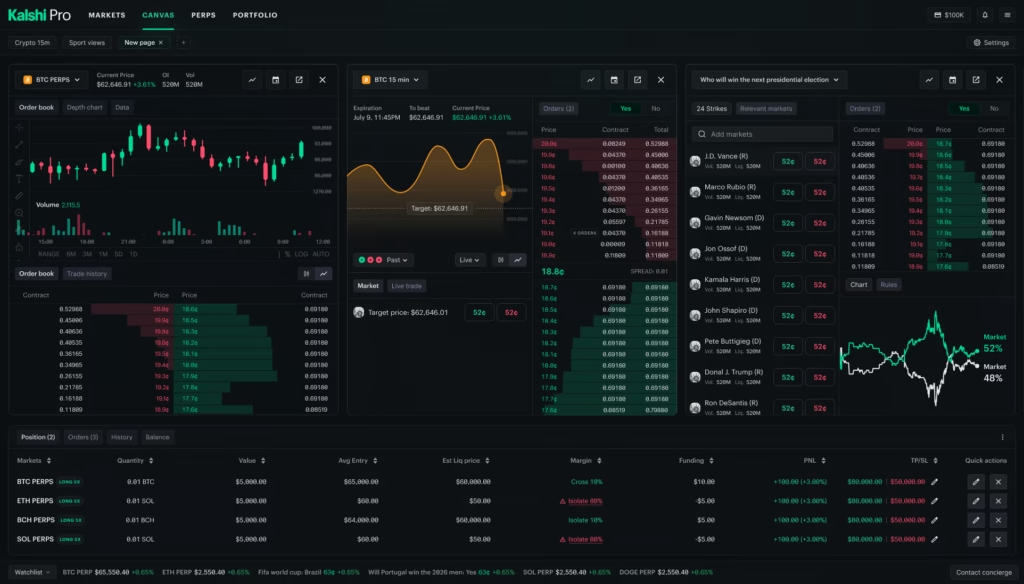
Kalshi Launches Pro Trading Terminal for Prediction Markets and Perps
Kalshi Pro gives active traders a customizable platform for monitoring markets,...

UFC 329 Odds Preview: Picks and Predictions for McGregor vs. Holloway and Tonight’s Full Card
The long-awaited return of Conor McGregor happens at UFC 329 tonight when he tak...
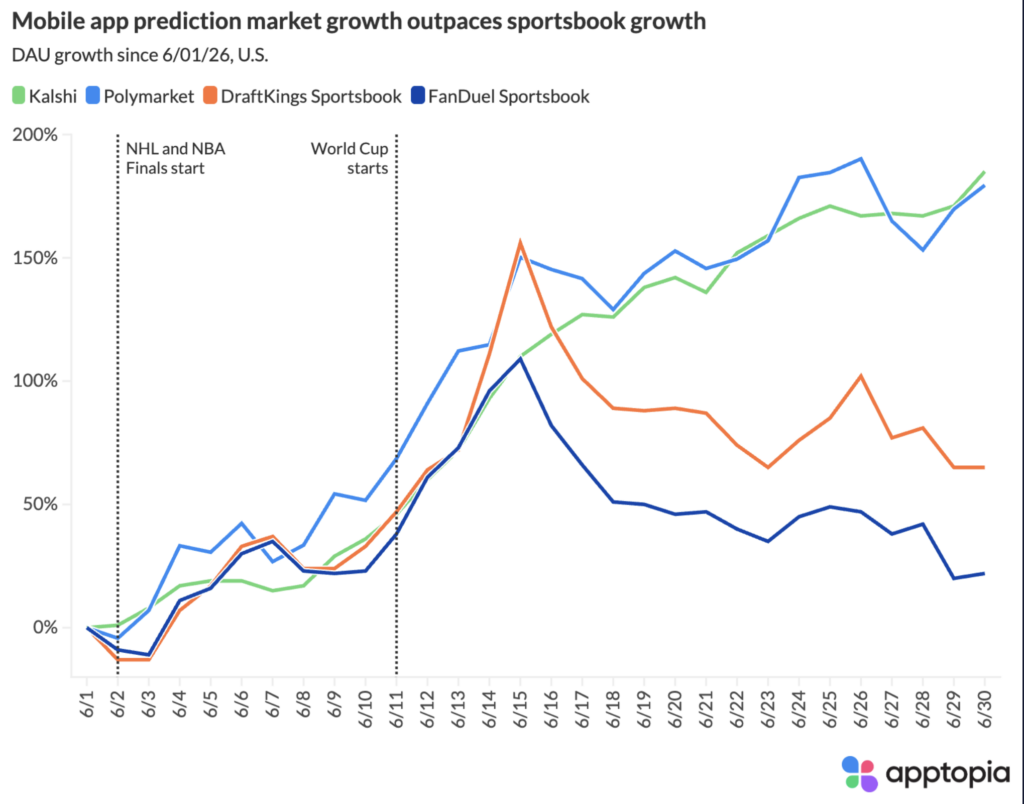
Kalshi Hits $1B on Winner Market as Prediction Sites Continue to Gain Daily Active Users During World Cup
Apptopia data shows prediction market apps continued adding users later in the W...