Kalshi Posts Record $2.9B Week on NCAA Basketball Tournaments as Polymarket Dips
Alex Smith
3 months ago
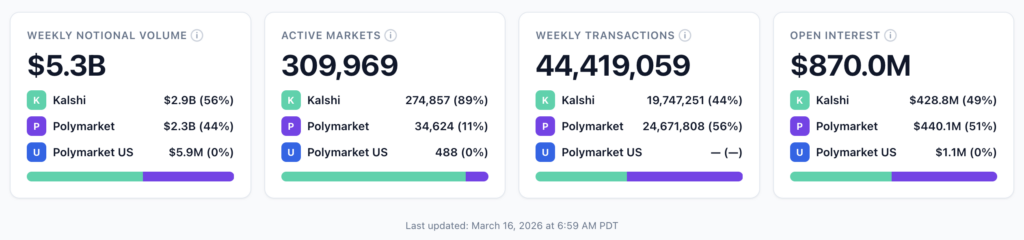
The weekly total dipped slightly, but the more telling story is Kalshi and Polymarket moved in opposite directions this week, driven by unrelated forces. Kalshi posted $2.93B in notional volume, its highest single-week total in the DeFi Rate tracking period, while Polymarket pulled back to $2.34B. Together they totaled $5.28B for the week of March 9–15, down modestly from $5.35B the prior week, as total industry volume across all tracked platforms hit $5.76B.
- Kalshi: $2.93B weekly volume (+2.7% WoW)
- Polymarket: $2.34B weekly volume (-6.1% WoW)
Across all tracked platforms, 44.4 million transactions were recorded for the week. The DeFi Rate prediction markets tracker has the full breakdown, including open interest by platform and category. Kalshi’s gains came almost entirely from conference championship basketball — four college games cracked its weekly top 10 ahead of Selection Sunday — while Polymarket’s most active market was a Federal Reserve rate decision that drew $141.9M over the previous seven days.
Some key takeaways from last week:
- NCAA basketball games appeared in Kalshi’s top 10 for the first time, with Wisconsin-Michigan leading at $9.2M as March Madness trading gets ready to ramp up.
- Three 2028 presidential markets on Polymarket combined for $121.5M, a meaningful volume driver with the election over two years out.
- The Oscars helped drive WoW surges in Entertainment trading volume on both Kalshi (326%) and Polymarket (96%), though the category remains small compared to Sports and Crypto category volumes on both platforms.
Kalshi vs. Polymarket trend
Kalshi extended its run of majority market share relative to Polymarket, adding $76.6M WoW (+2.7%) while Polymarket dropped $152.1M (-6.1%). The divergence traces cleanly to the sports calendar. Conference championship week with the Big Ten, SEC, Mountain West, and other major tournaments running simultaneously delivered a wave of short-duration, high-liquidity basketball markets that play directly to Kalshi’s strength in domestic sports outcomes.
On transactions, Polymarket still leads: 24.7 million trades versus Kalshi’s 19.7 million. Both platforms shed transactions WoW (Kalshi -1.5%, Polymarket -6.1%) meaning this week’s volume moves came from larger individual positions, not more activity. That reads clearly in the average bet sizes: Kalshi traders averaged $148.61 per trade (+4.2% WoW) while Polymarket came in at $95.01, essentially flat. The 1.6:1 ratio in average bet size has been a consistent feature across recent weeks, reflecting meaningfully different participant behavior. Polymarket is attracting higher-frequency, smaller-bet traders while Kalshi skews toward larger individual positions on a per-trade basis.
Kalshi vs. Polymarket — 6-week volume *, *::before, *::after { box-sizing: border-box; margin: 0; padding: 0; } body { font-family: 'Inter', sans-serif; background: #f8f7f4; padding: 16px; } .card { background: #ffffff; border: 1px solid #e2e8f0; border-radius: 8px; max-width: 780px; margin: 0 auto; overflow: hidden; } /* Header */ .header { padding: 20px 24px 0; } .header-title { font-size: 17px; font-weight: 700; color: #0f172a; line-height: 1.3; } .header-subtitle { font-size: 13px; color: #64748b; margin-top: 3px; } /* Metrics bar */ .metrics { display: flex; flex-wrap: wrap; gap: 8px; justify-content: center; padding: 16px 24px; border-bottom: 1px solid #e2e8f0; } .metric { text-align: center; padding: 8px 16px; background: #f8f7f4; border-radius: 6px; flex: 1 1 120px; min-width: 100px; } .metric-value { font-size: 18px; font-weight: 700; color: #0f172a; line-height: 1.2; } .metric-value.teal { color: #00D4AA; } .metric-value.purple { color: #8B5CF6; } .metric-label { font-size: 11px; color: #94a3b8; margin-top: 2px; font-weight: 500; text-transform: uppercase; letter-spacing: 0.04em; } /* Chart area */ .chart-wrap { padding: 20px 20px 8px; position: relative; } .chart-container { position: relative; width: 100%; /* let chart.js control height via aspectRatio */ } /* Legend */ .legend { display: flex; flex-wrap: wrap; gap: 12px 20px; justify-content: center; padding: 4px 24px 16px; } .legend-item { display: flex; align-items: center; gap: 6px; font-size: 12px; color: #64748b; font-weight: 500; } .legend-swatch { width: 12px; height: 12px; border-radius: 2px; flex-shrink: 0; } .legend-swatch.line { border-radius: 50%; border: 2px solid currentColor; background: transparent; width: 12px; height: 12px; } .legend-swatch.kalshi-bar { background: #00D4AA; } .legend-swatch.poly-bar { background: #8B5CF6; } .legend-swatch.kalshi-line { border-color: #00D4AA; } .legend-swatch.poly-line { border-color: #8B5CF6; } /* Table */ .table-wrap { overflow-x: auto; padding: 0 20px; -webkit-overflow-scrolling: touch; } table { width: 100%; border-collapse: collapse; font-size: 13px; min-width: 480px; } th { text-align: right; font-weight: 600; color: #64748b; font-size: 11px; text-transform: uppercase; letter-spacing: 0.04em; padding: 8px 10px; border-bottom: 2px solid #e2e8f0; } th:first-child { text-align: left; } td { text-align: right; padding: 8px 10px; color: #0f172a; border-bottom: 1px solid #f1f5f9; font-variant-numeric: tabular-nums; } td:first-child { text-align: left; color: #0f172a; font-weight: 600; } tr:last-child td { border-bottom: none; } .badge { display: inline-block; padding: 2px 7px; border-radius: 4px; font-size: 11px; font-weight: 600; } .badge.up { background: #d1fae5; color: #065f46; } .badge.down { background: #fee2e2; color: #991b1b; } .badge.na { background: #f1f5f9; color: #94a3b8; } /* Footer */ .footer { padding: 12px 24px 16px; border-top: 1px solid #e2e8f0; display: flex; align-items: center; justify-content: center; } .footer a { font-size: 11px; color: #94a3b8; text-decoration: none; font-weight: 500; } .footer a span { color: #00D4AA; } /* Mobile tweaks */ @media (max-width: 480px) { body { padding: 8px; } .header { padding: 16px 16px 0; } .header-title { font-size: 15px; } .metrics { padding: 12px 16px; gap: 6px; } .metric { padding: 6px 10px; } .metric-value { font-size: 15px; } .chart-wrap { padding: 14px 10px 4px; } .legend { padding: 4px 16px 12px; gap: 10px 14px; font-size: 11px; } .table-wrap { padding: 0 12px; } .footer { padding: 10px 16px 14px; } } Kalshi vs. Polymarket weekly volume & transactions Feb 2 – Mar 15, 2026 · 6 weeks $2.93B Kalshi Mar 9 $2.34B Polymarket Mar 9 55.6% Kalshi share (vs. Poly) Kalshi volume Polymarket volume Kalshi transactions Polymarket transactions Week of Kalshi vol. Poly vol. Kalshi WoW Poly WoW Feb 2 $2.80B $1.92B — — Feb 9 $2.43B $1.88B -13.2% -1.9% Feb 16 $2.59B $1.82B +6.8% -3.2% Feb 23 $2.73B $2.40B +5.3% +31.9% Mar 2 $2.86B $2.50B +4.7% +4.0% Mar 9 $2.93B $2.34B +2.7% -6.1% Source: DeFi Rate const labels = ['Feb 2', 'Feb 9', 'Feb 16', 'Feb 23', 'Mar 2', 'Mar 9']; // Volume in billions const kalshiVol = [2.7967, 2.4282, 2.5920, 2.7294, 2.8581, 2.9347]; const polyVol = [1.9154, 1.8796, 1.8200, 2.4002, 2.4964, 2.3443]; // Transactions in millions const kalshiTx = [17.9, 17.4, 17.6, 18.726, 20.041, 16.701]; const polyTx = [15.6, 19.6, 22.7, 24.625, 26.260, 24.672]; const ctx = document.getElementById('comboChart').getContext('2d'); const chart = new Chart(ctx, { data: { labels, datasets: [ { type: 'bar', label: 'Kalshi volume', data: kalshiVol, backgroundColor: 'rgba(0, 212, 170, 0.85)', borderColor: 'rgba(0, 212, 170, 1)', borderWidth: 1, borderRadius: 3, yAxisID: 'yVol', order: 2 }, { type: 'bar', label: 'Polymarket volume', data: polyVol, backgroundColor: 'rgba(139, 92, 246, 0.85)', borderColor: 'rgba(139, 92, 246, 1)', borderWidth: 1, borderRadius: 3, yAxisID: 'yVol', order: 2 }, { type: 'line', label: 'Kalshi transactions (M)', data: kalshiTx, borderColor: '#00D4AA', backgroundColor: 'rgba(0, 212, 170, 0.12)', borderWidth: 2.5, pointRadius: 5, pointHoverRadius: 7, pointBackgroundColor: '#00D4AA', pointBorderColor: '#fff', pointBorderWidth: 2, tension: 0.35, yAxisID: 'yTx', order: 1, spanGaps: false }, { type: 'line', label: 'Polymarket transactions (M)', data: polyTx, borderColor: '#8B5CF6', backgroundColor: 'rgba(139, 92, 246, 0.12)', borderWidth: 2.5, pointRadius: 5, pointHoverRadius: 7, pointBackgroundColor: '#8B5CF6', pointBorderColor: '#fff', pointBorderWidth: 2, tension: 0.35, yAxisID: 'yTx', order: 1, spanGaps: false } ] }, options: { responsive: true, maintainAspectRatio: true, aspectRatio: 1.85, interaction: { mode: 'index', intersect: false }, plugins: { legend: { display: false }, tooltip: { backgroundColor: '#0f172a', titleColor: '#94a3b8', bodyColor: '#f8fafc', padding: 12, cornerRadius: 6, titleFont: { size: 12, weight: '600', family: 'Inter' }, bodyFont: { size: 12, family: 'Inter' }, callbacks: { label: function(ctx) { const ds = ctx.dataset.label; const val = ctx.parsed.y; if (val === null) return null; if (ds.includes('transactions')) { return ` ${ds.replace(' (M)', '')}: ${val.toFixed(1)}M`; } return ` ${ds}: $${val.toFixed(2)}B`; } } } }, scales: { x: { grid: { display: false }, border: { display: false }, ticks: { color: '#64748b', font: { size: 12, family: 'Inter', weight: '500' } } }, yVol: { position: 'left', beginAtZero: true, grid: { color: '#f1f5f9', drawBorder: false }, border: { display: false, dash: [4, 4] }, ticks: { color: '#94a3b8', font: { size: 11, family: 'Inter' }, maxTicksLimit: 6, callback: v => '$' + v.toFixed(1) + 'B' }, title: { display: true, text: 'Weekly volume', color: '#94a3b8', font: { size: 11, family: 'Inter', weight: '500' } } }, yTx: { position: 'right', beginAtZero: true, grid: { drawOnChartArea: false }, border: { display: false }, ticks: { color: '#94a3b8', font: { size: 11, family: 'Inter' }, maxTicksLimit: 5, callback: v => v.toFixed(0) + 'M' }, title: { display: true, text: 'Transactions', color: '#94a3b8', font: { size: 11, family: 'Inter', weight: '500' } } } } } }); // Responsive: tighten aspect ratio on narrow screens function adjustAspect() { const w = window.innerWidth; chart.options.aspectRatio = w = 1000) return '$' + (v/1000).toFixed(2) + 'M'; return '$' + v.toFixed(1) + 'K'; } const maxVol = markets[0].volume; const tbody = document.getElementById('us-rows'); markets.forEach((m, i) => { const rank = i + 1; let rankClass = 'rank-plain'; if (rank === 1) rankClass = 'rank-gold'; else if (rank === 2) rankClass = 'rank-silver'; else if (rank === 3) rankClass = 'rank-bronze'; const pct = Math.round((m.volume / maxVol) * 100); tbody.innerHTML += ` ${rank} ${m.market} ${m.category} ${m.leading} ${m.pct}% ${fmtVol(m.volume)} `; });Category breakdown: Kalshi vs. Polymarket
The Oscars aired on March 15, the final day of the reporting window, and drove a late-week volume spike on both platforms that inflated what would otherwise have been modest numbers in those categories. Kalshi's Entertainment category surged 326% to $62.3M and Polymarket's Culture category nearly doubled to $59.1M (+95.8%), primarily due to trading on Oscars markets. Expect the category to normalize this week.
Strip out the Oscars effect and the Kalshi picture is defined by two diverging forces. Sports grew 5.0% to $2.09B, continuing its steady climb through conference tournament week, while Exotics cratered 33.0% to $256.4M after the prior week's parlay-driven surge. Those two moves largely offset each other within Kalshi's overall category mix. Politics and Elections categories combined fell 69.6% to $24.0M, reflecting the absence of a single high-profile event market like the prior week's Khamenei contracts. Crypto dipped modestly, down 9.7% to $233.6M.
On Polymarket global, Politics climbed 17.6% to $598.0M as the 2028 presidential markets deepened and the Fed decision contract dominated the top of the board. But that growth masked a 52.5% collapse in the Trump-specific category ($157.0M → $74.5M). Combined, politics-adjacent volume was essentially flat week over week ($665.7M → $672.5M), but shifted away from Trump-specific markets. Sports fell 9.1% to $925.4M, giving back some of last week's gains, while Crypto declined 13.5% to $625.7M alongside a softer week for Bitcoin price action.
The structural cross-platform picture holds. Kalshi runs 71% sports (actually more with exotics included); Polymarket runs 61% non-sports. Kalshi's non-sports total was $841.3M this week; Polymarket's was $1.4B. The two platforms are drawing on different audiences for different purposes, and this week's data continued that trend.
Kalshi vs. Polymarket category volume: This week vs. last week
Category breakdown: Kalshi vs. Polymarket *, *::before, *::after { box-sizing: border-box; margin: 0; padding: 0; } body { font-family: 'Inter', sans-serif; background: #f8f7f4; padding: 16px; } .card { background: #ffffff; border: 1px solid #e2e8f0; border-radius: 8px; max-width: 780px; margin: 0 auto; overflow: hidden; } /* Header */ .header { padding: 20px 24px 0; } .header-title { font-size: 17px; font-weight: 700; color: #0f172a; line-height: 1.3; } .header-subtitle { font-size: 13px; color: #64748b; margin-top: 3px; } /* Metrics bar */ .metrics { display: flex; flex-wrap: wrap; gap: 8px; justify-content: center; padding: 16px 24px; border-bottom: 1px solid #e2e8f0; } .metric { text-align: center; padding: 8px 16px; background: #f8f7f4; border-radius: 6px; flex: 1 1 130px; min-width: 110px; } .metric-value { font-size: 18px; font-weight: 700; line-height: 1.2; } .metric-value.teal { color: #00D4AA; } .metric-value.purple { color: #8B5CF6; } .metric-label { font-size: 11px; color: #94a3b8; margin-top: 2px; font-weight: 500; text-transform: uppercase; letter-spacing: 0.04em; } /* Legend */ .legend { display: flex; flex-wrap: wrap; gap: 10px 20px; justify-content: center; padding: 16px 24px 4px; } .legend-item { display: flex; align-items: center; gap: 6px; font-size: 12px; color: #64748b; font-weight: 500; } .legend-swatch { width: 12px; height: 12px; border-radius: 2px; flex-shrink: 0; } .swatch-kalshi { background: #00D4AA; } .swatch-poly { background: #8B5CF6; } /* Chart */ .chart-wrap { padding: 12px 20px 16px; } .chart-container { position: relative; width: 100%; } /* Table */ .table-wrap { overflow-x: auto; -webkit-overflow-scrolling: touch; padding: 0 20px; border-top: 1px solid #e2e8f0; } table { width: 100%; border-collapse: collapse; font-size: 12.5px; min-width: 500px; } th { padding: 8px 10px; font-size: 10px; font-weight: 600; text-transform: uppercase; letter-spacing: 0.05em; color: #94a3b8; text-align: right; border-bottom: 2px solid #e2e8f0; white-space: nowrap; } th:first-child { text-align: left; } td { padding: 9px 10px; border-bottom: 1px solid #f1f5f9; text-align: right; font-variant-numeric: tabular-nums; color: #0f172a; vertical-align: middle; } td:first-child { text-align: left; font-weight: 600; color: #0f172a; } tr:last-child td { border-bottom: none; } tr:hover td { background: #fafafa; } .badge { display: inline-block; padding: 2px 6px; border-radius: 4px; font-size: 10.5px; font-weight: 600; white-space: nowrap; } .up { background: #d1fae5; color: #065f46; } .down { background: #fee2e2; color: #991b1b; } .na { background: #f1f5f9; color: #94a3b8; } .oscars { background: #fef9c3; color: #854d0e; } .vol-strong { font-weight: 700; color: #0f172a; } /* Total row */ .total-row td { background: #f8f7f4; font-weight: 700; border-top: 2px solid #e2e8f0; border-bottom: none; } /* Footer */ .footer { padding: 12px 24px 14px; border-top: 1px solid #e2e8f0; text-align: center; } .footer a { font-size: 11px; color: #94a3b8; text-decoration: none; font-weight: 500; } .footer a span { color: #00D4AA; } .footnote { padding: 8px 24px 0; font-size: 10.5px; color: #94a3b8; line-height: 1.5; } @media (max-width: 480px) { body { padding: 8px; } .header { padding: 16px 16px 0; } .header-title { font-size: 15px; } .metrics { padding: 12px 16px; gap: 6px; } .metric { padding: 6px 10px; } .metric-value { font-size: 15px; } .legend { padding: 12px 16px 4px; gap: 8px 14px; } .chart-wrap { padding: 10px 10px 12px; } .table-wrap { padding: 0 12px; } .footer { padding: 10px 16px 12px; } .footnote { padding: 8px 16px 0; } } Category breakdown: Kalshi vs. Polymarket Weekly volume by category — week of March 9–15, 2026 71.3% Kalshi sports share 60.5% Poly non-sports share +326% Entertainment WoW* Kalshi Polymarket *Oscars aired March 15. Entertainment/Culture spike reflects end-of-week event volume; expected to normalize. Category Kalshi vol. WoW Δ Polymarket vol. WoW Δ Sports $2.09B +5.0% $925.4M -9.1% Exotics (Kalshi only) $256.4M -33.0% — — Crypto $233.6M -9.7% $625.7M -13.5% Politics / Elections $24.0M -69.6% $598.0M +17.6% Trump (Polymarket only) — — $74.5M -52.5% Entertainment / Culture* $62.3M +326%* $59.1M +95.8%* Economics / Finance $23.8M +13.6% $20.9M -8.3% Climate / Weather $21.6M +17.2% $28.0M +31.7% Total $2.93B +2.7% $2.34B -6.1% Source: DeFi Rate // Categories for chart — 4 shared comparable categories only // Exotics, Trump, Economics/Finance, Climate/Weather in table only const categories = [ 'Sports', 'Crypto', 'Politics /\nElections', 'Entertainment /\nCulture', ]; const kalshiVol = [2093.5, 233.6, 24.0, 62.3]; const polyVol = [925.4, 625.7, 598.0, 59.1]; const ctx = document.getElementById('catChart').getContext('2d'); const chart = new Chart(ctx, { type: 'bar', data: { labels: categories, datasets: [ { label: 'Kalshi', data: kalshiVol, backgroundColor: 'rgba(0, 212, 170, 0.85)', borderColor: 'rgba(0, 212, 170, 1)', borderWidth: 1, borderRadius: 3, }, { label: 'Polymarket', data: polyVol, backgroundColor: 'rgba(139, 92, 246, 0.85)', borderColor: 'rgba(139, 92, 246, 1)', borderWidth: 1, borderRadius: 3, } ] }, options: { responsive: true, maintainAspectRatio: true, aspectRatio: 1.7, interaction: { mode: 'index', intersect: false }, plugins: { legend: { display: false }, tooltip: { backgroundColor: '#0f172a', titleColor: '#94a3b8', bodyColor: '#f8fafc', padding: 12, cornerRadius: 6, titleFont: { size: 12, weight: '600', family: 'Inter' }, bodyFont: { size: 12, family: 'Inter' }, callbacks: { label: ctx => { const v = ctx.parsed.y; const fmt = v >= 1000 ? '$' + (v/1000).toFixed(2) + 'B' : '$' + v.toFixed(1) + 'M'; return ` ${ctx.dataset.label}: ${fmt}`; } } } }, scales: { x: { grid: { display: false }, border: { display: false }, ticks: { color: '#64748b', font: { size: 11, family: 'Inter', weight: '500' }, maxRotation: 0, autoSkip: false, } }, y: { beginAtZero: true, grid: { color: '#f1f5f9' }, border: { display: false }, ticks: { color: '#94a3b8', font: { size: 11, family: 'Inter' }, maxTicksLimit: 6, callback: v => { if (v >= 1000) return '$' + (v/1000).toFixed(1) + 'B'; return '$' + v + 'M'; } } } } } }); function adjustAspect() { chart.options.aspectRatio = window.innerWidth { const rank = i + 1; let rankClass = 'rank-plain'; if (rank === 1) rankClass = 'rank-gold'; else if (rank === 2) rankClass = 'rank-silver'; else if (rank === 3) rankClass = 'rank-bronze'; const pct = Math.round((m.volume / maxVol) * 100); const vol = '$' + m.volume.toFixed(1) + 'M'; tbody.innerHTML += ` ${rank} ${m.market} ${m.category} ${vol} Closed `; });Polymarket top 10 markets by volume, last 7 days
Polymarket top 10 markets — week of March 9 *, *::before, *::after { box-sizing: border-box; margin: 0; padding: 0; } body { font-family: 'Inter', sans-serif; background: #f8f7f4; padding: 16px; } .card { background: #ffffff; border: 1px solid #e2e8f0; border-radius: 8px; max-width: 720px; margin: 0 auto; overflow: hidden; } .header { padding: 20px 24px 16px; border-bottom: 1px solid #e2e8f0; } .platform-badge { display: inline-flex; align-items: center; gap: 5px; background: #f0ebff; color: #6d3fd6; font-size: 11px; font-weight: 600; padding: 3px 8px; border-radius: 4px; margin-bottom: 6px; letter-spacing: 0.03em; } .platform-badge .dot { width: 7px; height: 7px; border-radius: 50%; background: #8B5CF6; flex-shrink: 0; } .header-title { font-size: 16px; font-weight: 700; color: #0f172a; line-height: 1.3; } .header-subtitle { font-size: 12px; color: #94a3b8; margin-top: 3px; } .table-wrap { overflow-x: auto; -webkit-overflow-scrolling: touch; } table { width: 100%; border-collapse: collapse; font-size: 13px; min-width: 460px; } thead tr { background: #f8f7f4; } th { padding: 9px 16px; font-size: 10px; font-weight: 600; text-transform: uppercase; letter-spacing: 0.06em; color: #94a3b8; text-align: left; border-bottom: 1px solid #e2e8f0; white-space: nowrap; } th.right { text-align: right; } td { padding: 11px 16px; border-bottom: 1px solid #f1f5f9; color: #0f172a; vertical-align: middle; } td.right { text-align: right; font-variant-numeric: tabular-nums; } td.center { text-align: center; } tr:last-child td { border-bottom: none; } tr:hover td { background: #fafafa; } .rank { display: inline-flex; align-items: center; justify-content: center; width: 24px; height: 24px; border-radius: 6px; font-size: 11px; font-weight: 700; flex-shrink: 0; } .rank-gold { background: #fef3c7; color: #92400e; } .rank-silver { background: #f1f5f9; color: #475569; } .rank-bronze { background: #fdf2e9; color: #9a3412; } .rank-plain { background: #f8f7f4; color: #94a3b8; } .market-name { font-weight: 500; color: #0f172a; line-height: 1.35; } .category-tag { display: inline-block; font-size: 10px; font-weight: 500; color: #94a3b8; margin-top: 2px; } .vol-value { font-weight: 600; color: #0f172a; font-variant-numeric: tabular-nums; } .oi-value { font-weight: 500; color: #64748b; font-variant-numeric: tabular-nums; font-size: 12px; } .vol-bar-wrap { display: flex; align-items: center; gap: 8px; justify-content: flex-end; } .vol-bar-bg { width: 60px; height: 5px; background: #f1f5f9; border-radius: 3px; overflow: hidden; flex-shrink: 0; } .vol-bar-fill { height: 100%; background: #8B5CF6; border-radius: 3px; } .status-badge { display: inline-block; font-size: 10px; font-weight: 600; padding: 2px 7px; border-radius: 4px; white-space: nowrap; } .status-active { background: #d1fae5; color: #065f46; } .status-closing { background: #fef9c3; color: #854d0e; } .status-closed { background: #f1f5f9; color: #64748b; } .footer { padding: 11px 24px; border-top: 1px solid #e2e8f0; text-align: center; } .footer a { font-size: 11px; color: #94a3b8; text-decoration: none; font-weight: 500; } .footer a span { color: #8B5CF6; } @media (max-width: 480px) { body { padding: 0; } .card { border-radius: 0; border-left: none; border-right: none; max-width: 100%; } .header { padding: 16px 16px 14px; } .header-title { font-size: 14px; } td, th { padding: 10px 12px; } .vol-bar-bg { width: 36px; } .rank { width: 22px; height: 22px; font-size: 10px; } } Polymarket Top 10 markets by volume Last 7 days ending March 15, 2026 # Market Volume (7d) Open int. Status Source: DeFi Rate const markets = [ { market: "Fed decision in March?", category: "Economics", volume: 141.9, oi: 50.8, status: "closing" }, { market: "Republican Presidential Nominee 2028",category: "Politics", volume: 50.6, oi: 11.1, status: "active" }, { market: "Democratic Presidential Nominee 2028",category: "Politics", volume: 42.0, oi: 8.5, status: "active" }, { market: "2026 FIFA World Cup Winner", category: "Sports", volume: 29.1, oi: 2.0, status: "active" }, { market: "Presidential Election Winner 2028", category: "Politics", volume: 28.9, oi: 3.9, status: "active" }, { market: "UEFA Champions League Winner", category: "Sports", volume: 18.6, oi: 3.3, status: "active" }, { market: "Will Crude Oil hit $__ by end of March?", category: "Finance", volume: 17.7, oi: 8.3, status: "active" }, { market: "What price will Bitcoin hit in March?",category: "Finance", volume: 17.6, oi: 9.4, status: "active" }, { market: "2026 NBA Champion", category: "Sports", volume: 17.5, oi: 0.7, status: "active" }, { market: "Netanyahu out by...?", category: "Politics", volume: 17.3, oi: 9.3, status: "active" }, ]; function fmtVol(v) { if (v >= 1000) return '$' + (v/1000).toFixed(2) + 'B'; return '$' + v.toFixed(1) + 'M'; } function fmtOI(v) { if (!v) return '—'; if (v >= 1000) return '$' + (v/1000).toFixed(2) + 'B'; return '$' + v.toFixed(1) + 'M'; } const maxVol = markets[0].volume; const tbody = document.getElementById('poly-rows'); markets.forEach((m, i) => { const rank = i + 1; let rankClass = 'rank-plain'; if (rank === 1) rankClass = 'rank-gold'; else if (rank === 2) rankClass = 'rank-silver'; else if (rank === 3) rankClass = 'rank-bronze'; const pct = Math.round((m.volume / maxVol) * 100); let statusLabel, statusClass; if (m.status === 'active') { statusLabel = 'Active'; statusClass = 'status-active'; } if (m.status === 'closing') { statusLabel = 'Closing soon'; statusClass = 'status-closing'; } if (m.status === 'closed') { statusLabel = 'Closed'; statusClass = 'status-closed'; } tbody.innerHTML += ` ${rank} ${m.market} ${m.category} ${fmtVol(m.volume)} ${fmtOI(m.oi)} ${statusLabel} `; });Full platform volume comparison
Overall prediction market industry volume based on Dune Analytics tracked platforms reached $5.76B for the week of March 9–15, down $133.9M (-2.3%) from the prior week's $5.89B. The decline was concentrated in Opinion Markets, which fell 50.0% WoW to $77.9M — its fifth consecutive weekly drop and a 94%+ retreat from its $1.81B peak in late December.
Excluding Opinion, remaining tracked platforms were up slightly on aggregate. Crypto.com (+27.3% to $156.1M) and predict.fun (+18.1% to $91.2M) were the week's strongest performers by WoW growth rate among named platforms.
March Madness expected to lift the tides
Selection Sunday took place on March 15, setting the 64-team bracket for the 2026 NCAA Tournament. First- and second-round games run March 19–22, after First Four play-in games March 17-18. March Madness markets historically generate some of the most concentrated sports volume of the calendar year with short windows, high stakes, and upset-friendly formats that produce significant two-sided action on the majority of games.
Kalshi's conference tournament performance this week suggests the demand is already priced in. Four tournament-week games cracked the weekly top 10 before the bracket was finalized, trading at volume levels comparable to the platform's most active NBA games. March Madness could push Kalshi above $3.5B in a single week, a threshold it has not yet reached. We will also be watching for whether Polymarket can close the gap with its own NCAAB surge, and how much growth its US platform can achieve across the action-packed March Madness schedule.
The post Kalshi Posts Record $2.9B Week on NCAA Basketball Tournaments as Polymarket Dips appeared first on DeFi Rate.
Related Articles

Referrals Are Live: Refer & Earn on Synthetix
Referrals on Synthetix are now live.Create & share your referral code and ea...
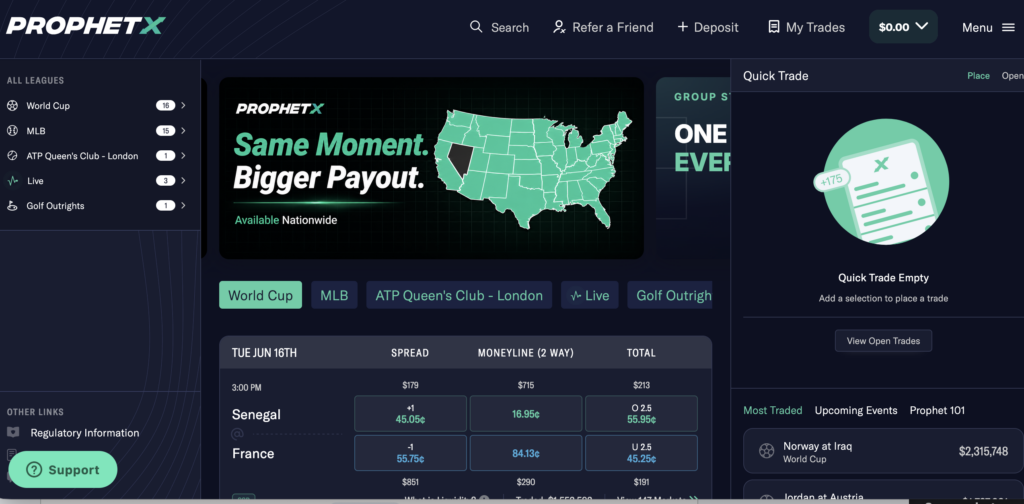
Novig Receives CFTC Approval as ProphetX Launches Sports Prediction Markets Days After Designation
Novig targets a summer rollout after earning CFTC designation, while ProphetX we...
Introducing ETH as Margin on Synthetix
Multicollateral margin is now live on Synthetix and ETH is the first non-USDT as...
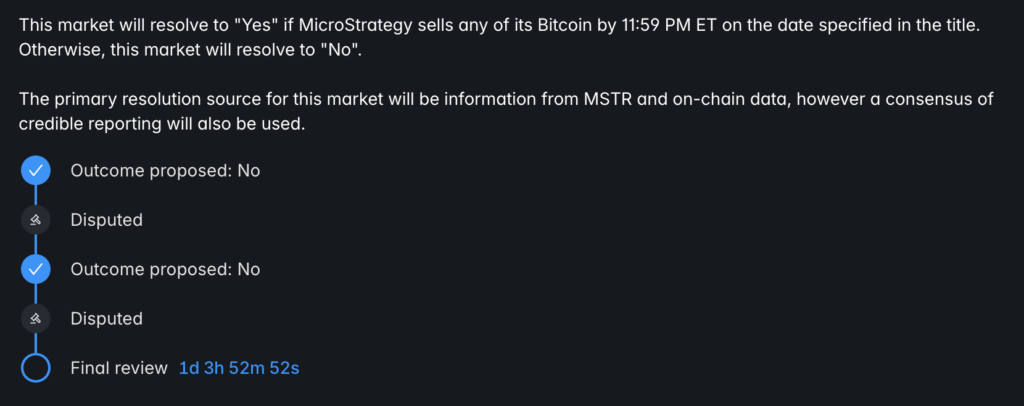
Polymarket Trader Loses $500K After Rules Change on Microstrategy BTC Market
A $175 million Polymarket market on MicroStrategy's Bitcoin holdings resolved ag...