MCX Forms A Double-Bottom Pattern Hinting At A Near-Term Bullish Reversal; Check The Details
Alex Smith
2 months ago

Synopsis: Multi-Commodity Exchange of India Ltd has formed a double-bottom pattern on the 1-hour chart, indicating a potential near-term bullish reversal.
The emergence of a double-bottom pattern following an extended downtrend reflects strong buying interest at lower levels. A decisive breakout above the neckline signals a possible transition toward a bullish trend.
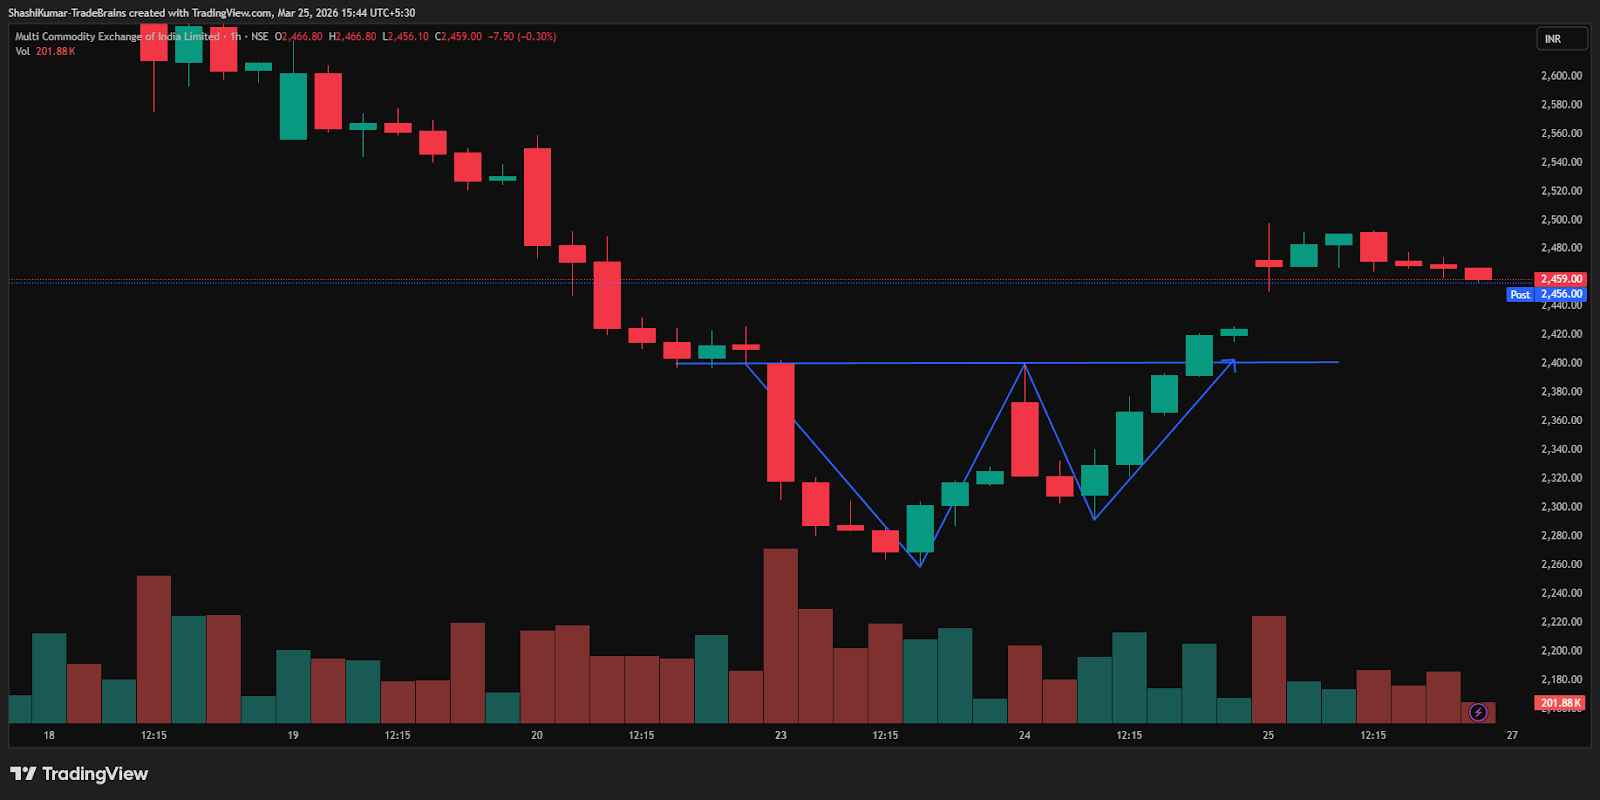
On the chart, the stock has broken above the double-bottom neckline and is continuing to hold above that level. On Wednesday, Multi Commodity Exchange of India Ltd moved above the double-bottom neckline on the 1-hour chart, confirming the pattern with consistent buying volume. Holding above the Rs 2,400 support level points to near-term bullish momentum and the potential for further upside.
In a double-bottom pattern, upside targets are generally set at resistance levels above the neckline. Traders often look to book profits at these points while keeping an eye on momentum to assess whether the trend will continue or show signs of fading.
Multi Commodity Exchange of India Ltd Chart: 1-hour Timeframe
Indicator Confirmation
- RSI: The daily RSI indicates bullish reversal, as it rose from 47.10 in the previous trading session to 49.83 on Wednesday.
- Price Volume Trend: The Price Volume Indicator confirms the uptrend, accompanied by an increase in buying volume in the daily time frame.
- On-Balance Volume: The rising OBV and rising price confirmed the trend is a strong, sustainable upward trend driven by high buying pressure.
Implications
A double-bottom pattern indicates a potential move higher. A decisive close above Rs 2,400, backed by strong volumes, would confirm the reversal. Holding above this level as support would further reinforce the near-term bullish outlook.
About the stock
The Multi Commodity Exchange of India (MCX), established in 2003, is India’s leading commodity derivatives exchange and the world’s largest for commodity options. It holds about 98% market share in commodity futures trading value for FY 2024–25. With a nationwide presence, MCX enables fair price discovery and risk management, offering trading across bullion, energy, metals, agricultural commodities, and sectoral indices, while maintaining strategic partnerships with global exchanges and trade bodies.
Over the past month, the stock of Multi Commodity Exchange of India Ltd has edged up by 0.28%. Over a six-month period, it has climbed sharply by 53.06%, while on a year-over-year basis, the stock has surged by an impressive 138.16%. For more such technical stock ideas, click here to view our research page.
Disclaimer: The views and investment tips expressed by investment experts/broking houses/rating agencies on tradebrains.in are their own, and not that of the website or its management. Investing in equities poses a risk of financial losses. Investors must therefore exercise due caution while investing or trading in stocks. Trade Brains Technologies Private Limited or the author are not liable for any losses caused as a result of the decision based on this article. Please consult your investment advisor before investing.
The post MCX Forms A Double-Bottom Pattern Hinting At A Near-Term Bullish Reversal; Check The Details appeared first on Trade Brains.
Related Articles

Stock to Benefit from India’s Naval Defence and Data Centre Boom
Synopsis: As India accelerates naval modernisation and data centre expansion, Sh...

5 Stocks With High Customer Retention to Look Out For
Synopsis: Five listed Indian companies operating across depository services, cre...
Top 5 Stocks Supplying Critical Battery Materials for India’s EV Revolution
Synopsis: Five listed Indian companies are quietly building the chemical and mat...

Why Does Macquarie Think Syngene Shares Could Rally 67% From Current Levels?
Synopsis: Macquarie maintains an Outperform rating on Syngene International, see...