Solana (SOL) Tumbles to $80, Traders Watch Critical Support Defense
Alex Smith
3 months ago
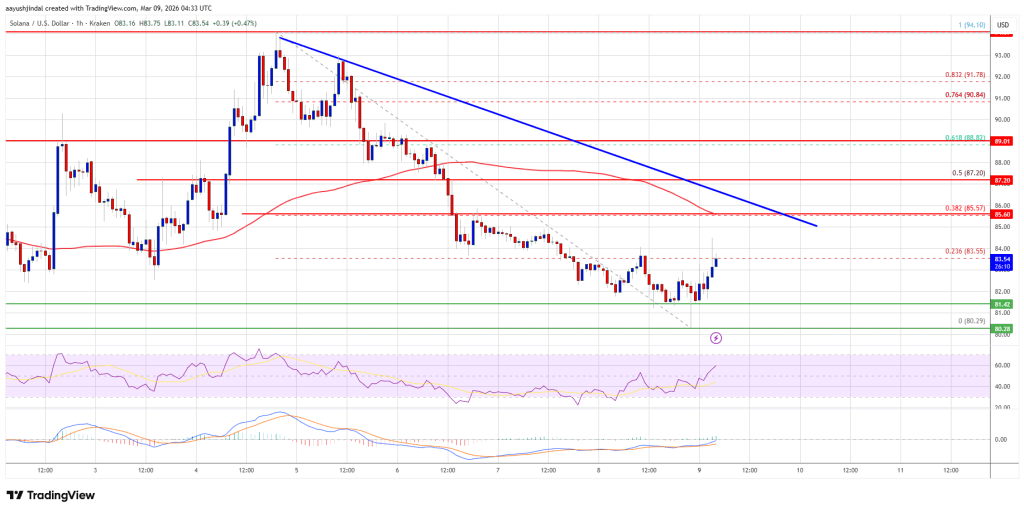
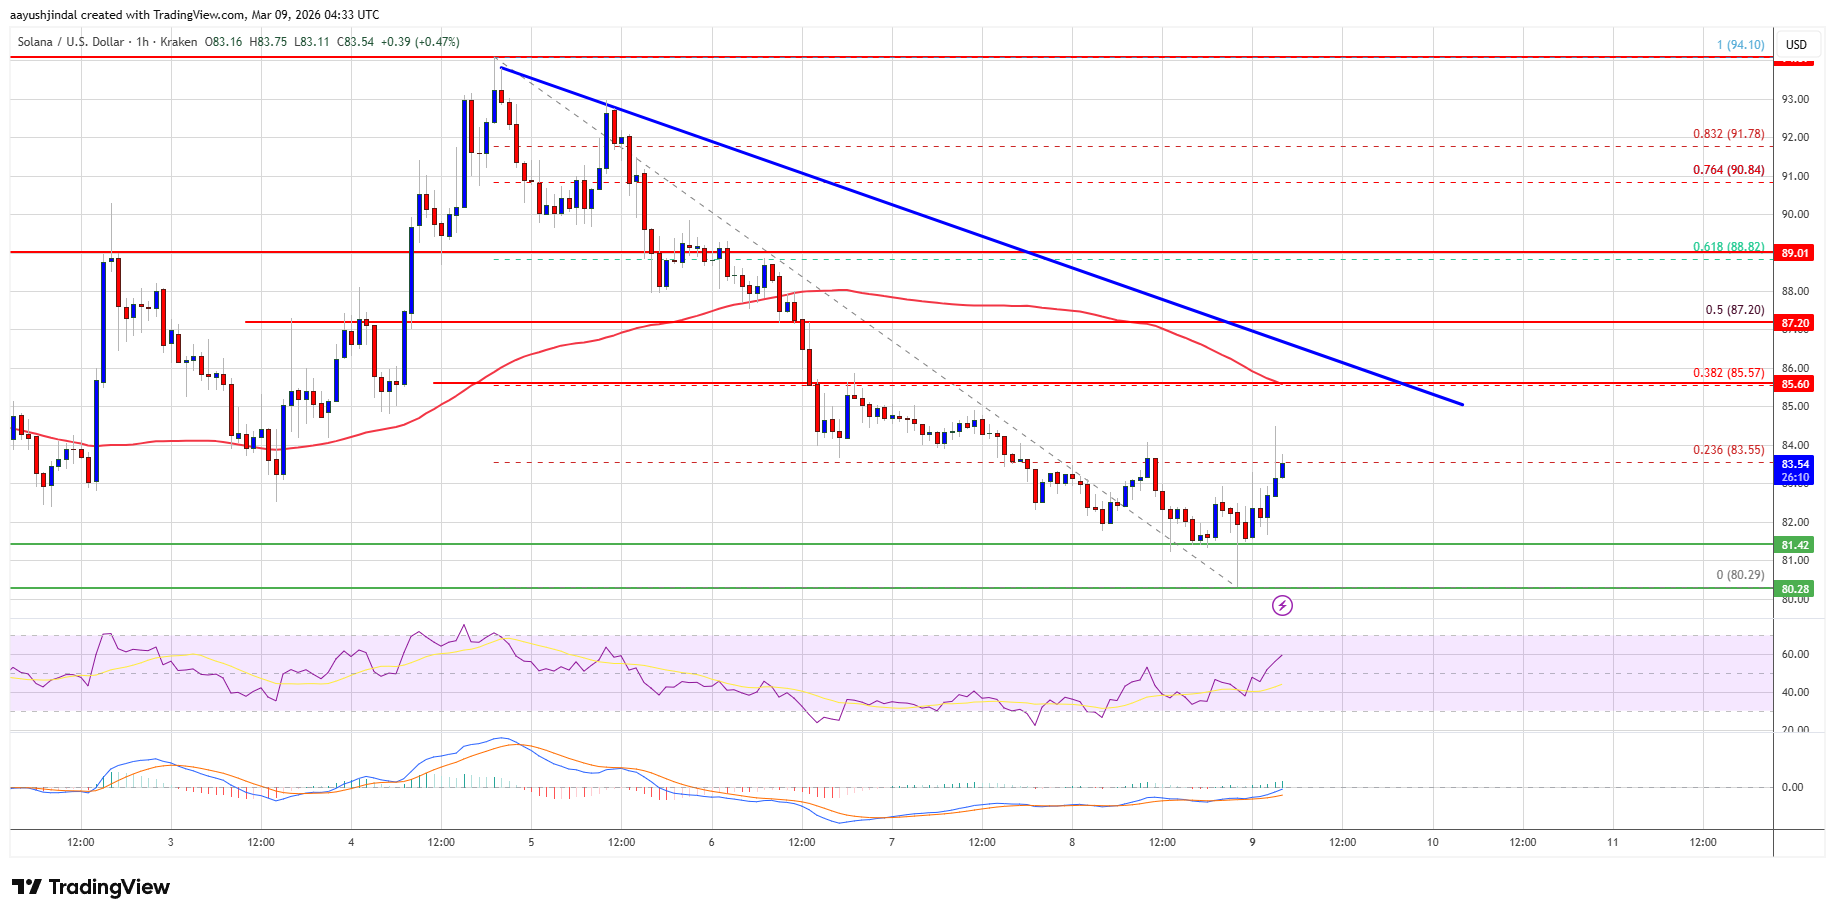
Solana failed to settle above $90 and extended losses. SOL price is now consolidating losses below $85 and might struggle to start a recovery wave.
- SOL price started a fresh decline below $85 and $82 against the US Dollar.
- The price is now trading below $85 and the 100-hourly simple moving average.
- There is a key bearish trend line forming with resistance at $85.50 on the hourly chart of the SOL/USD pair (data source from Kraken).
- The price could start a recovery wave if the bulls defend $82 or $80.
Solana Price Revisits $80
Solana price failed to remain stable above $90 and started a fresh decline, like Bitcoin and Ethereum. SOL declined below the $88 and $85 support levels.
The price gained bearish momentum below $83.50. A low was formed at $80.29, and the price is now consolidating losses below the 23.6% Fib retracement level of the downward move from the $94.10 swing high to the $80.29 low.
Solana is now trading below $85 and the 100-hourly simple moving average. On the upside, immediate resistance is near the $85 level. There is also a key bearish trend line forming with resistance at $85.50 on the hourly chart of the SOL/USD pair.
The next major resistance is near the $87.20 level or the 50% Fib retracement level of the downward move from the $94.10 swing high to the $80.29 low. The main resistance could be $88.80. A successful close above the $88.80 resistance zone could set the pace for another steady increase. The next key resistance is $95. Any more gains might send the price toward the $102 level.
More Losses In SOL?
If SOL fails to rise above the $85 resistance, it could continue to move down. Initial support on the downside is near the $82 zone. The first major support is near the $80 level.
A break below the $80 level might send the price toward the $72 support zone. If there is a close below the $72 support, the price could decline toward the $65 support in the near term.
Technical Indicators
Hourly MACD – The MACD for SOL/USD is losing pace in the bearish zone.
Hourly Hours RSI (Relative Strength Index) – The RSI for SOL/USD is above the 50 level.
Major Support Levels – $82 and $80.
Major Resistance Levels – $85 and $88.
Related Articles

Bitcoin Is Trading More Like A Macro Asset, Binance India Says
Binance India says Bitcoin’s relationship with traditional assets has become mor...

Bitcoin Bearish Breakdown Setup Warns Sellers Still Control The Larger Structure
A TradingView analyst says BTC has confirmed a bearish breakdown from a multi-mo...

Zcash Fixes Critical Orchard Vulnerability As ZEC Holds $600 Support
Zcash has patched a dangerous vulnerability in its privacy-focused infrastructur...

Bitcoin Falls Below $66K As Short-Term Holder Stress Reaches February Levels
Bitcoin has lost the $66,000 level as selling pressure and uncertainty intensify...