Technical View: Nifty, Bank Nifty & Sensex Trade Setup and Key levels to watch for 15th December
Alex Smith
3 months ago

Indian benchmark indices closed higher on Friday, building on positive momentum for the second straight session amid optimistic global cues and hopes for a US-India trade deal. Both Nifty 50 and BSE Sensex opened with a gap-up, traded above key exponential moving averages, and ended well above psychological levels, with RSI indicators signalling room for further upside below overbought territory.
Sectoral performance was broadly bullish, led by metals, realty, and consumer durables, while FMCG and media lagged. Asian markets mirrored the optimism, with major indices in Japan, Hong Kong, China, and South Korea posting solid gains. Over the week, indices saw a modest dip, but a late recovery was fueled by the US Federal Reserve’s rate cut and trade deal expectations, alongside silver hitting a historic high in India.
In this overview, we will analyse the key technical levels and trend directions for Nifty and BSE Sensex to monitor in the upcoming trading sessions. All the charts mentioned below are based on the 15-minute timeframe.
NIFTY 50 Chart & Price Action Analysis
To view other technical reports, click here
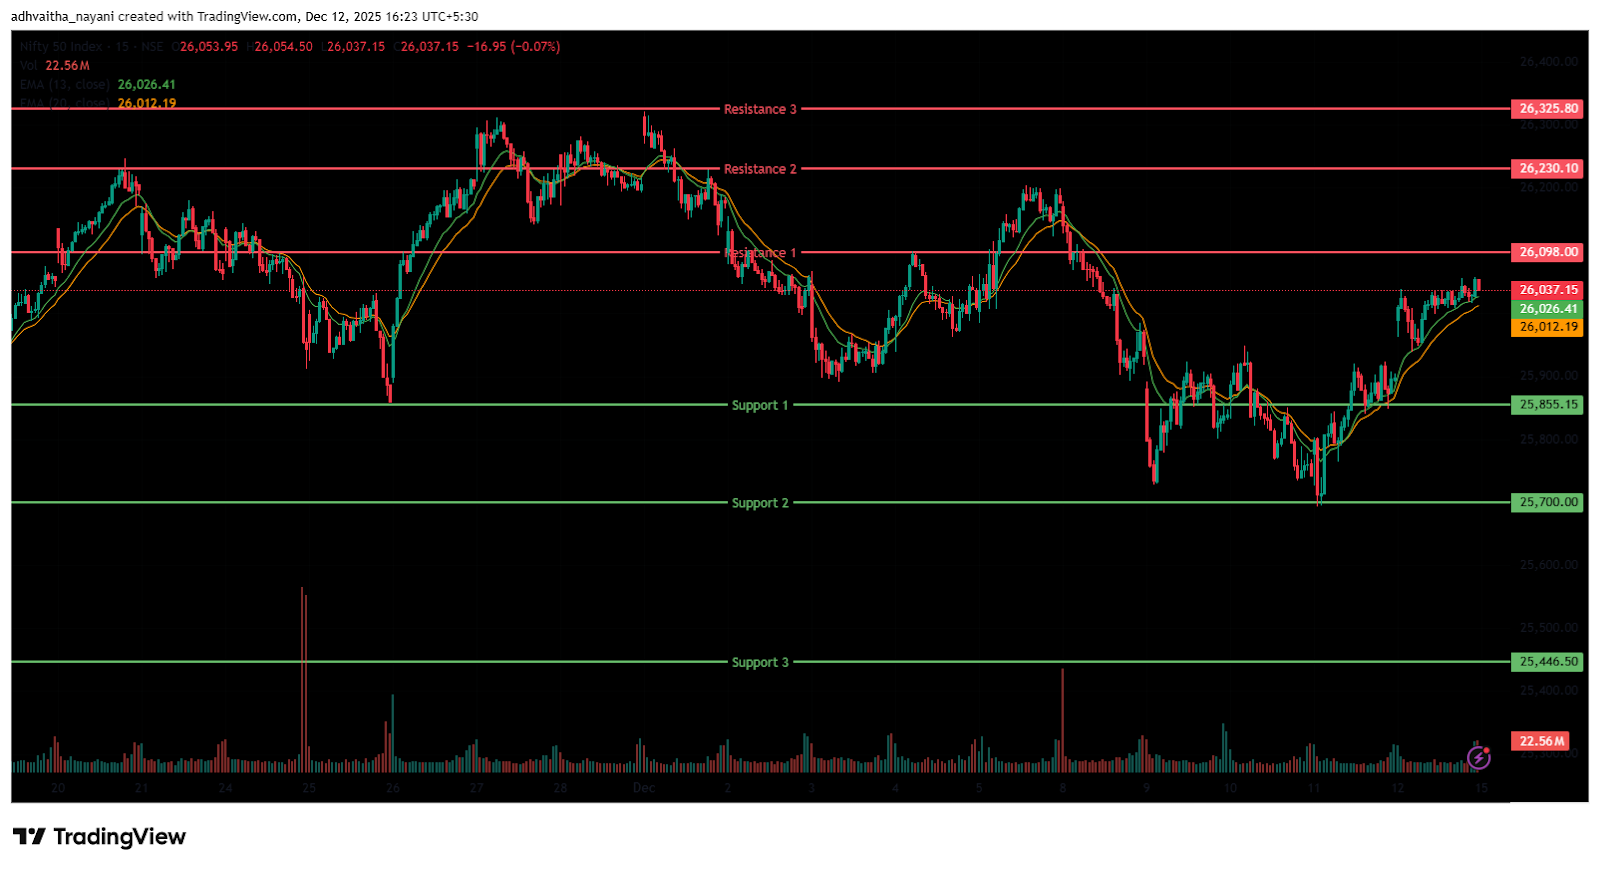
The Nifty 50 Index opened with a positive note at 25,971.20 on Friday, up by 72.65 points from Thursday’s closing of 25,898.55. The index opened on a gap-up note above 25,950 but quickly faced high volatility and dropped to the day’s low of 25,938.45, which proved to be strong support near the 25,950 level. From there, it stabilised and regained momentum around the 26,000 level, rallying to nearly 26,050 in the morning session. Throughout the morning, it moved between 25,950 and 26,050.
In the afternoon, the index continued its uptrend, reaching its day high at 26,057.60, eventually closing near the 26,050 level. In the afternoon session, the Index was traded sideways within a broader range of 26,000 to 26,050. Finally, it had closed on a positive note at 26,046.95, up by 148.40 points, or 0.57%. In the short term, the Index was trading above the 13- and 20-day EMA, indicating a short-term bullish outlook in the daily time frame.
The Nifty 50’s nearest resistance levels are at 26,098 (R1) and 26,230.10 (R2), and a higher resistance at 26,325.80 (R3), which is the all-time high for the index. On the other hand, the closest support is now at 25,855.15 (S1), and the next one at 25,700 (S2), which were previous resistances now acting as support. If the index falls below this, the next strong support level to watch is at 25,446.50 (S3).
Trade Setup:
Nifty 50Resistance 326,325.80Resistance 226,230.10Resistance 126,098.00Closing Price26,046.95Support 125,855.15Support 225,700.00Support 325,446.50NIFTY 50 Momentum Indicators Analysis
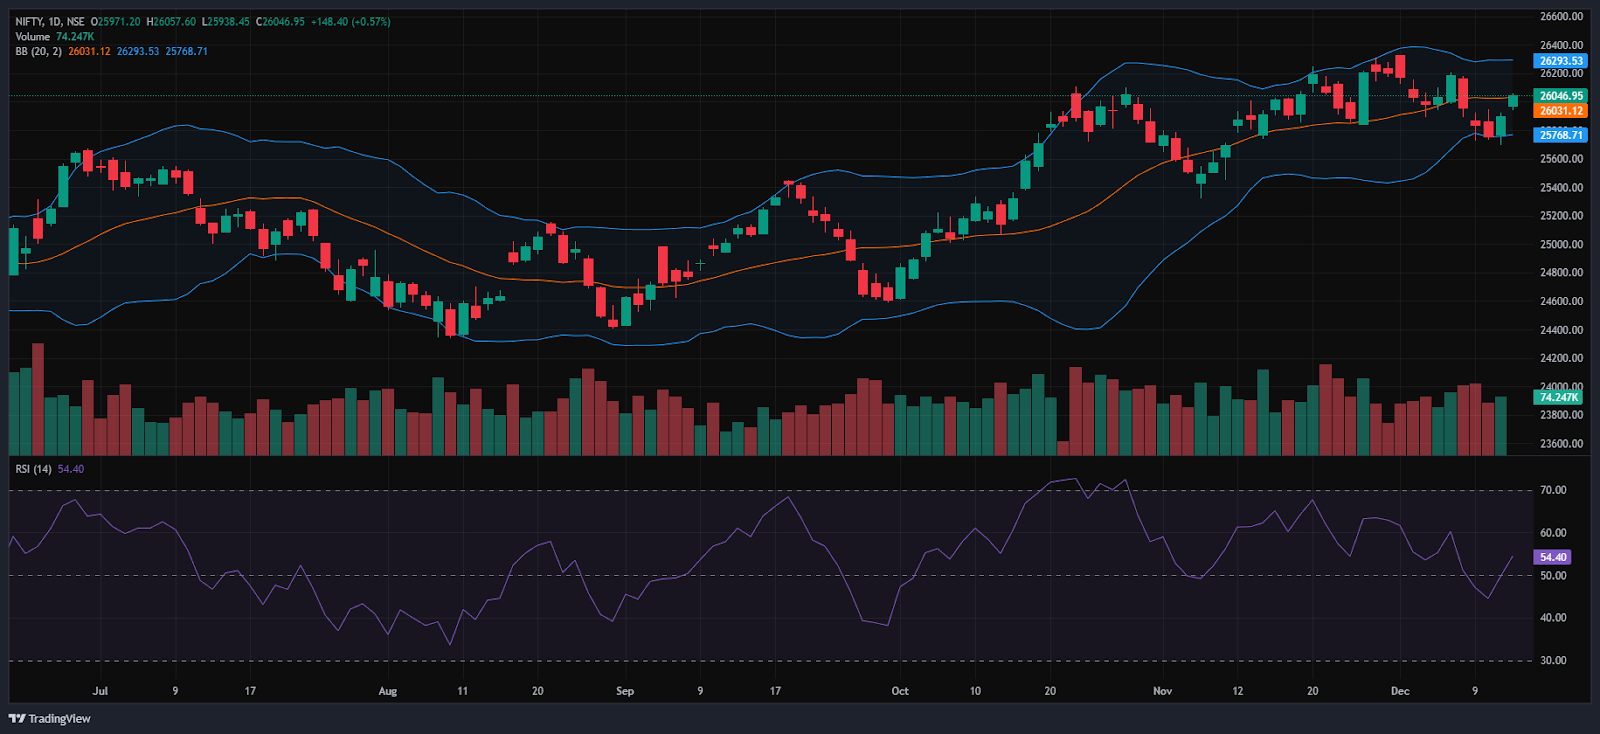
RSI (Daily): The Nifty 50’s RSI stood at 54.40, which is below the overbought zone of 70, generally indicating a Bullish trend.
Bollinger Bands (Daily): The index is closed in the upper band of the Bollinger Band range above the middle band. Its position in the upper range suggests a bullish sentiment in the short term. On Friday, the Index formed a Strong bullish candlestick pattern after taking support near 25,950, featuring a small upper wick and a long lower wick. It consistently held above the 26,000 mark and hovered around 26,050 for most of the session. A sustained move above the middle band signals a bullish sentiment, while a drop back toward the lower band may reinforce bearish sentiment.
Volume Analysis: Friday’s trading session had an average volume of 216.32 Mn.
Derivatives Data: Options open interest (OI) data suggest a strong support zone around 25,900 and 26,000, where put option writing is high, indicating traders expect the index to hold these levels. On the upside, significant call option open interest at 26,100 and 26,200 signals resistance, as sellers are likely to defend these strike prices. The Put/Call Ratio (PCR) stands at 1.14, which is above 1 and indicates a neutral to bearish sentiment with more put activity than call. The presence of a long unwinding indicates traders are exiting profitable long (buy) positions, showing weakening confidence, leading to increased selling pressure that pushes prices down, which is generally considered a strong bearish sentiment. This combination implies the market may trade in a range, with strong support near 25,900-26,000 and resistance near 26,100-26,200, until a decisive breakout occurs.
Bank Nifty Chart & Price Action Analysis
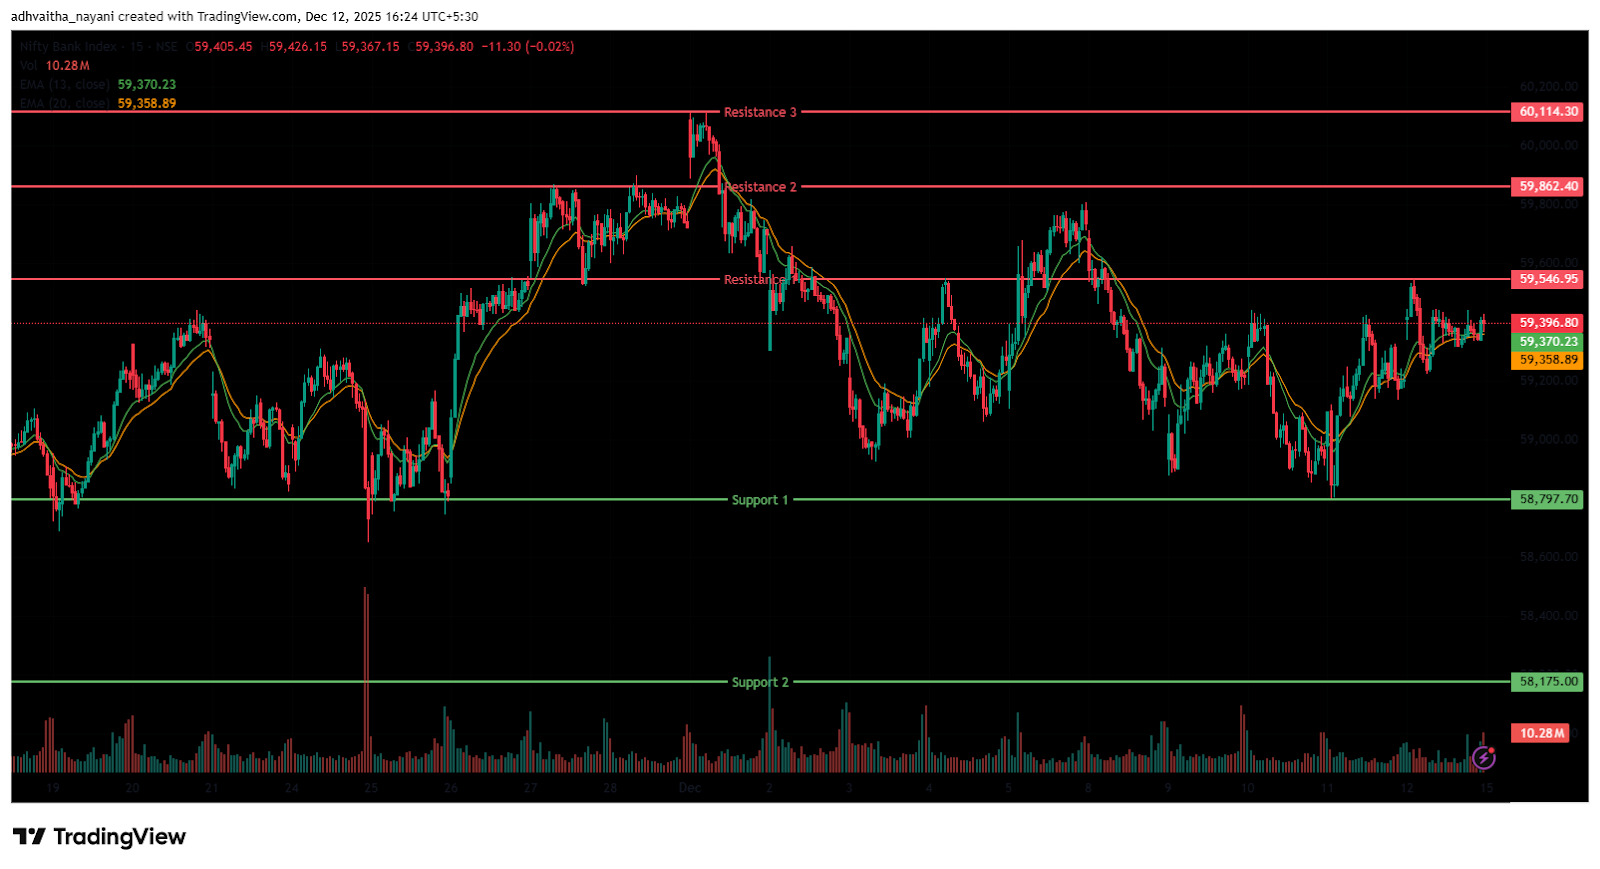
The Bank Nifty Index opened on a positive note at 59,401.50 on Friday, up by 191.65 points from Thursday’s closing of 59,209.85. The index started on a gap-up note and moved upwards, marking its day high near the 59,545.70 level. Later, due to high volatility, the Index dropped to 59,224.85, marking its day low during the morning session. Further, the Index took support near the 59,240 level and recovered from the day’s low to above the 59,350 level. The Index was trading between the 59,240 and 59,400 levels.
In the afternoon session, the index dipped slightly to the 59,300 level and finally settled near the 59,390 mark. Overall, it was trading between the levels of 59,300 and 59,400. Finally, it had closed at 59,389.95 on a positive note, up 180.10 points or 0.30%. The Relative Strength Index (RSI) stood at 58.20, below the overbought zone of 70 in the daily time frame. In the daily time frame, the Index closed above the 13- and 20-day EMA, indicating a bullish outlook in the near term and formed a doji candlestick pattern, indicating indecision.
The nearest resistance is at 59,546.95 (R1) and 59,862.40 (R2). The higher resistance is at 60,114.30 (R3), which is the all-time high for the index. On the other hand, the closest support is now at 58,797.70 (S1), and the next support is at 58,175 (S2), where the index has taken support at this level previously.
Trade Setup:
Bank NiftyResistance 360,114.30Resistance 259,862.40Resistance 159,546.95Closing Price59,389.95Support 158,797.70Support 258,175.00BSE Sensex Chart & Price Action Analysis
To view other technical reports, click here
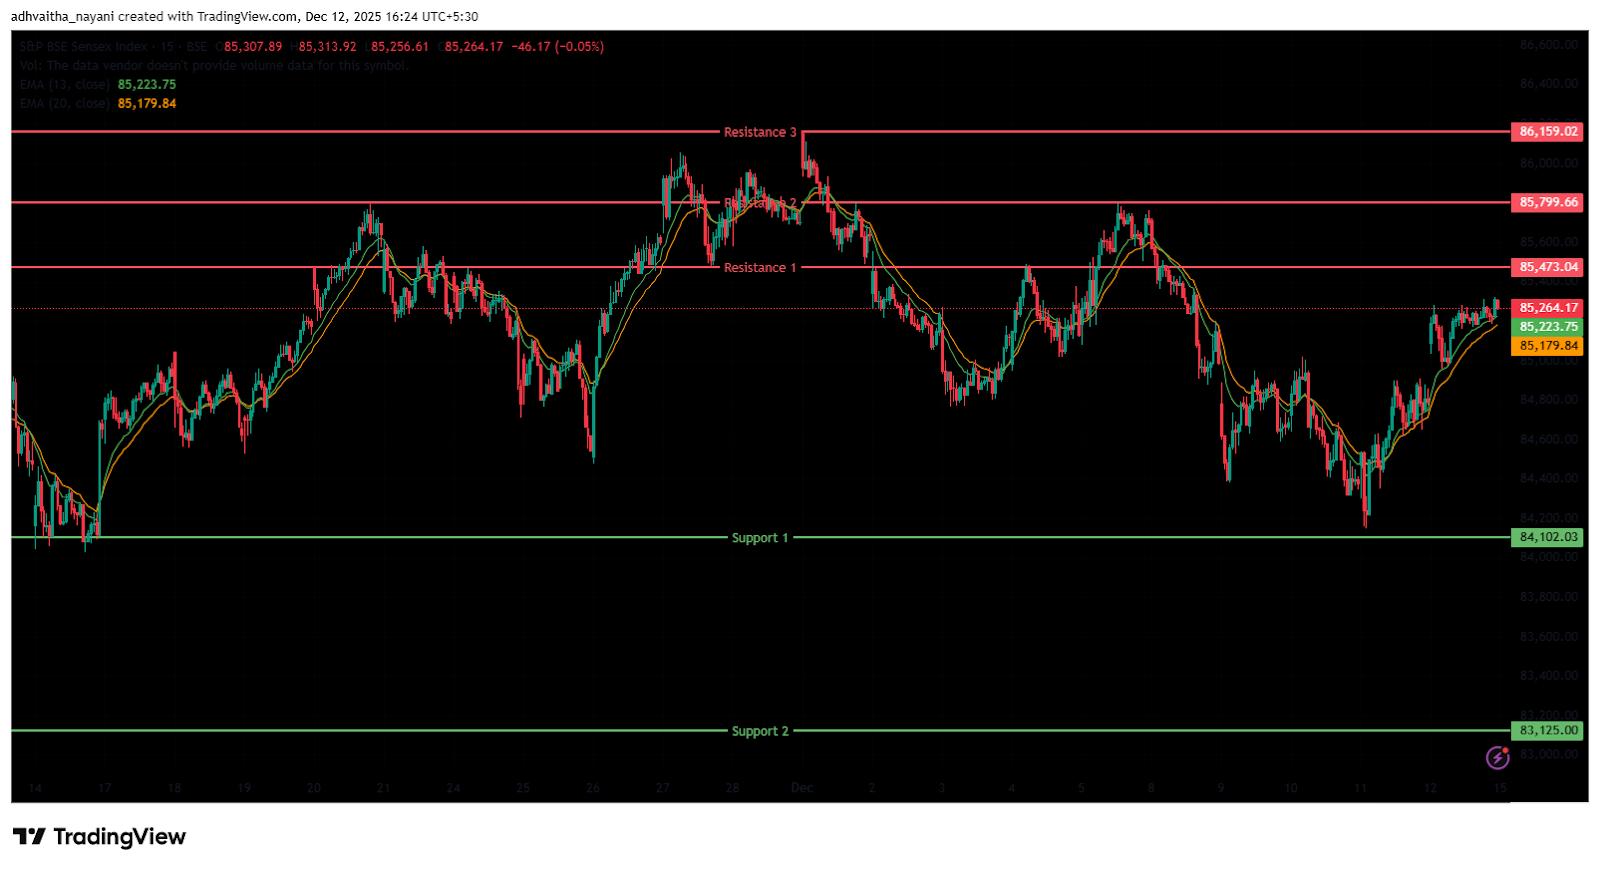
The BSE Sensex Index opened on a positive note, opening at 85,051.03 on Friday, up by 232.9 points from Thursday’s closing of 84,818.13. The Sensex index started the session on a gap-up note and made a high of 85,282.76. Later, due to high volatility, the index was dragged down below the 85,000 mark and took support near the 84,990 level; later, the index pulled back to above the 85,250 level. The index was trading between the 84,950 and 85,250 levels.
In the afternoon session, the index was trading in a range-bound manner between the levels of 85,180 and 85,300. It had a day’s high at 85,320.82. Finally, it had closed at 85,267.66 on a positive note, up 449.52 points or 0.53%. The Relative Strength Index (RSI) stood at 55.39, below the overbought zone of 70 in the daily time frame. In the short term, the index was above the 13- and 20-day in the daily time frame, indicating a short-term bullish trend.
The index faces immediate resistance at 85,473.03 (R1) and 85,799.66 (R2). The higher resistance is at 86,159.02 (R3), a level near its all-time high. On the downside, the nearest support lies at 84,102.03 (S1) and the next one at 83,125.00 (S2).
Trade Setup:
SensexResistance 386,159.02Resistance 285,799.66Resistance 185,473.04Closing Price85,267.66Support 184,102.03Support 283,125.00Market Recap on December 12th, 2025
On Friday, the Nifty 50 opened with a gap-up at 25,971.20, up by 72.65 points from its previous close of 25,898.55. The index hit an intraday high of 26,057.60 and closed on a positive note, above the 26,000 level at 26,046.95, up 148.40 points, or 0.57%. The index closed above all four EMAs: 20/50/100/200-day on the daily chart. The BSE Sensex followed the same trajectory, opening on a positive trend at 85,051.03, up 232.9 points from the previous close of 84,818.13.
It closed at 85,267.66, up 449.53 points, or 0.53%. Both indices showed positive momentum. RSI values for the Nifty 50 were at 54.4 and the Sensex at 55.4, below the overbought threshold of 70. The benchmark indices were positive for the second consecutive day, buoyed by hopes of a US-India trade deal and optimistic global cues, including the U.S. Federal Reserve’s recent interest rate cut.
On Friday, most of the indices ended on a bullish note, with the Nifty Metal index remaining the major gainer, up 2.63% or 269.60 points, closing at 10,536. Among the gainers, Hindustan Zinc Ltd was the major gainer, increasing by 7.46%, followed by Hindustan Copper Ltd, National Aluminium Company Ltd, and NMDC Ltd, all of which gained by up to 7%.
The Nifty Realty index is also among the highest gainers, increasing 1.53% or 13.35 points to close at 886.55. Anant Raj Ltd led the gains with 9% rise, followed by Sobha Ltd, Godrej Properties Ltd, and Brigade Enterprises Ltd, all gaining up to 3% on Friday. The Nifty Consumer Durable index also gained by 1.46% or 528.45 points to close at 36,830.45.
The Nifty FMCG index was in red, closing at 54,490.8, shedding -128.85 points or -0.24%. Hindustan Unilever Ltd was the major laggard, dropping by -1.95%, followed by Dabur India Ltd, and ITC Ltd, which fell by up to -1.35%. The Nifty Media index was also in red, falling -0.70 points or -0.05% to close at 1,409.85. Major losers were D B Corp Ltd, Nazara Technologies Ltd, and Network 18 Media & Investments Ltd, which fell up to -1.28%.
Asian equity markets closed bullish on Friday. Japan’s Nikkei 225 gained by 1.45% or 740.18 points to 50,889. While Hong Kong’s Hang Seng Index increased by 419.49 points, or 1.62%, to 25,950. China’s Shanghai Composite rose 16.03 points, or 0.41%, to 3,889.35, and South Korea’s KOSPI increased by 56.54 points, or 1.36%, closing at 4,167.16.
This week, the Nifty 50 dipped 0.53% (139.50 points), while the BSE Sensex declined 0.65% (387.25 points). Late-week optimism stemmed from the US Federal Reserve’s 25 basis point rate cut, bolstered by expectations of an India-US trade deal. Meanwhile, silver surged past the historic Rs 2 lakh per kg milestone in India for the first time.
India VIX
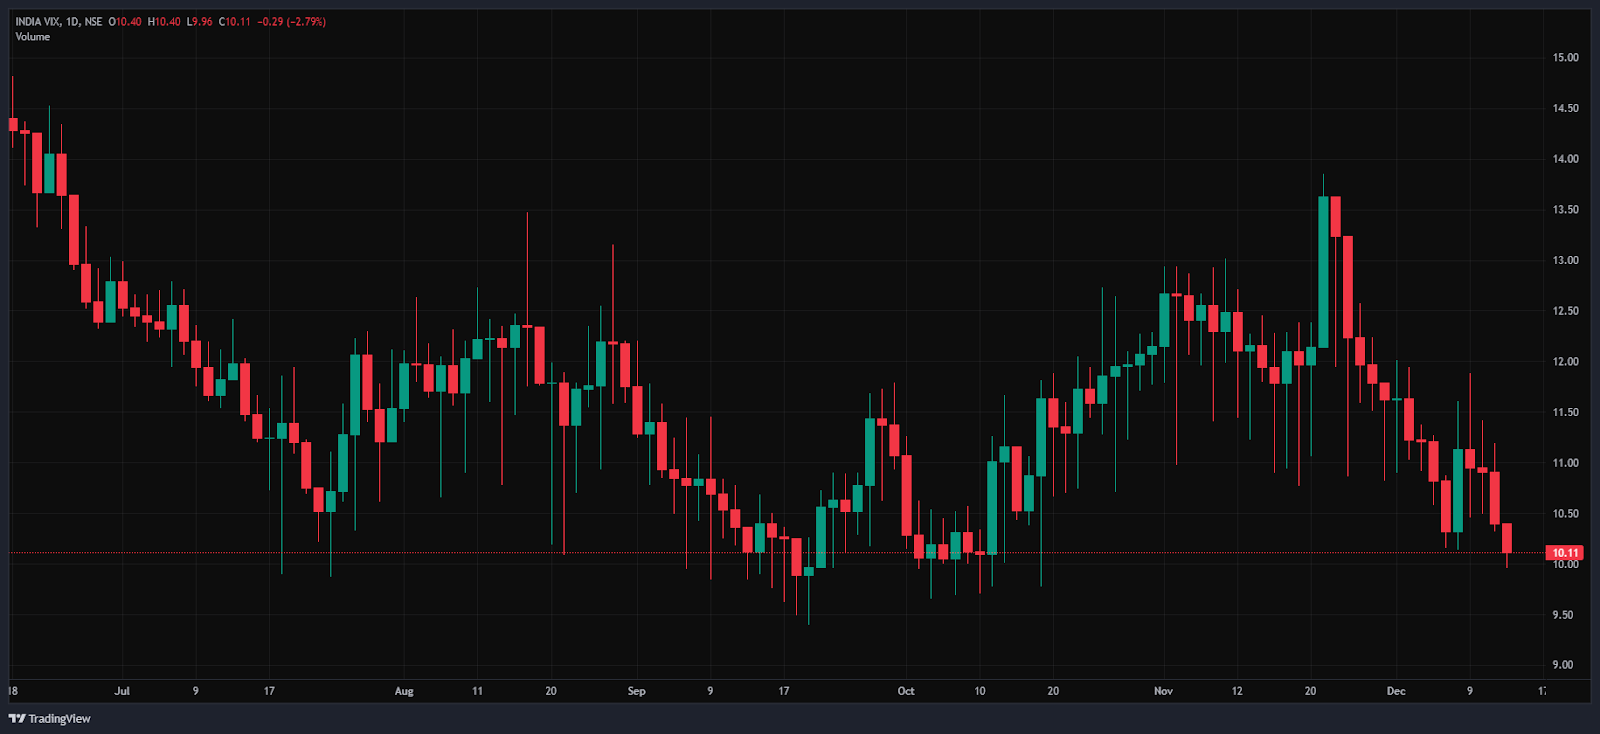
The India VIX fell to 10.11, down by 0.29 points (2.79%) during Friday’s trading session, indicating a downtrend in expected market volatility in the daily time frame. However, overall volatility remains low, since the India VIX is generally considered elevated only when it rises above 15.
Given the ongoing volatility and mixed sentiments, it’s advisable to avoid aggressive positions and wait for clear directional moves above resistance or below support. Traders should consider these key support and resistance levels when entering long or short positions following the price break from these critical levels. Additionally, traders can combine moving averages to identify more accurate entry and exit points.
DisclaimerThe views and investment tips expressed by investment experts/broking houses/rating agencies on tradebrains.in are their own, and not that of the website or its management. Investing in equities poses a risk of financial losses. Investors must therefore exercise due caution while investing or trading in stocks. Trade Brains Technologies Private Limited or the author are not liable for any losses caused as a result of the decision based on this article. Please consult your investment advisor before investing.
About: Trade Brains Portal is a stock analysis platform. Its trade name is Dailyraven Technologies Private Limited, and its SEBI-registered research analyst registration number is INH000015729.
Investments in securities are subject to market risks. Read all the related documents carefully before investing.
Registration granted by SEBI and certification from NISM in no way guarantee performance of the intermediary or provide any assurance of returns to investors.
The post Technical View: Nifty, Bank Nifty & Sensex Trade Setup and Key levels to watch for 15th December appeared first on Trade Brains.
Related Articles

Why did Solarium Green shares jump 18% today?
Synopsis: Solar Energy stock gained strong market attention after securing a ma...

Steel Stock hits 10% upper circuit after its sales soar 33% YoY
SYNOPSIS: India’s largest stainless steel wire manufacturing company reported st...

Sattrix Information Shares Surges 5%; Wins Rs 2.65 Crore Firewall Order from Global Tier-1 Enterprise
Synopsis: Sattrix Information Security Limited has secured a ₹2.65 crore contrac...

From IRCTC to IndiGo: 8 Stocks Driving India’s Tourism Boom
From IRCTC to IndiGo: 8 stocks powering India’s booming tourism ecosystem SYNOPS...