Technical View: Nifty, Bank Nifty & Sensex Trade Setup and Key levels to watch for 28th November
Alex Smith
6 months ago

The market opened on a positive note, with both the Nifty 50 and Sensex moving in an upward direction and even touching fresh highs during the day. They continued to trade above all key moving averages, showing strong overall momentum. RSI levels for both indices stayed below the overbought zone, indicating steady but controlled buying interest. Broader markets were mostly flat to mildly positive as investors remained cautious and focused on key upcoming events such as GDP data, the US-India agreement, and the RBI policy meeting.
Sectoral performance was mixed. Media and financial stocks gained the most, supported by strong moves in select companies. On the other hand, oil & gas and realty stocks faced selling pressure, dragging their indices lower. Asian markets also ended the day on a positive note, reflecting improved global sentiment and supporting the overall optimism in domestic markets.
In this overview, we will analyse the key technical levels and trend directions for Nifty and BSE Sensex to monitor in the upcoming trading sessions. All the charts mentioned below are based on the 15-minute timeframe.
NIFTY 50 Chart & Price Action Analysis
To view other technical reports, click here
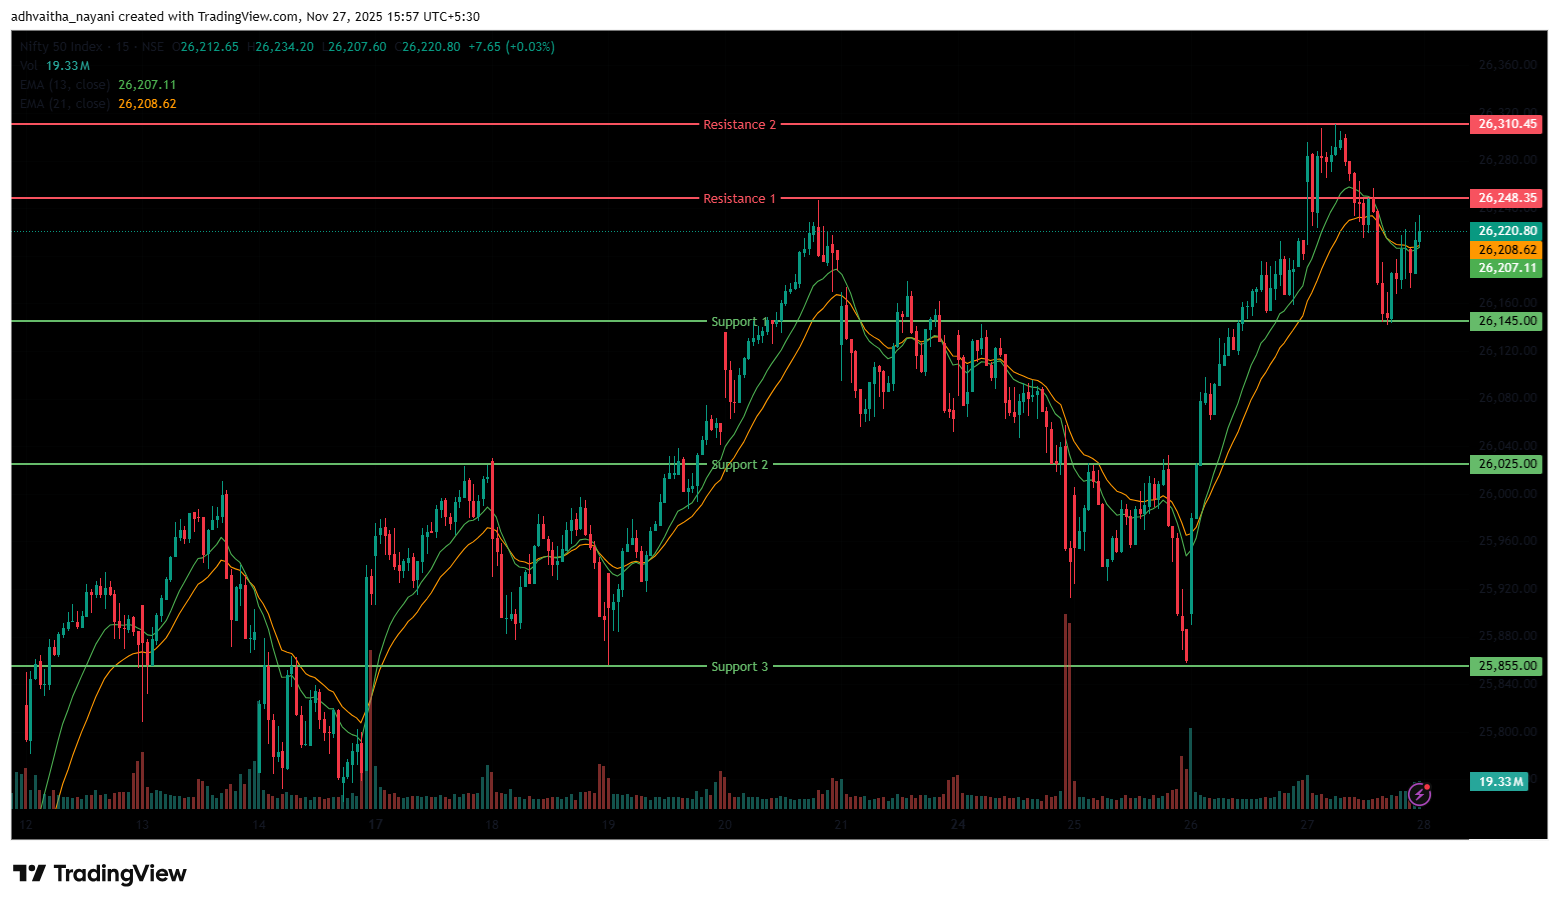
The Nifty 50 Index opened on a positive note at 26,261.25 on Thursday, up by 55.95 points from Wednesday’s closing of 26,205.30. The index opened on an optimistic note and hit an all-time high at 26,310.45 during the morning session. But the index did not sustain above the 26,300 level and was trading within the range of 26,200 and 26,300.
In the afternoon session, the index continued to drop further and reached its day’s low at 26,141.9. The index was trading between the range of 26,140 and 26,240. Finally, it had closed on a flatter note at 26,215.55, above the 26,200 level, up 10.25 points, or 0.04%. In the short term, the Index was above the 13/20-day EMA, indicating a near-term bullish trend in the daily time frame.
The Nifty 50’s nearest resistance level is at 26,248.35 (R1), where the index has failed to sustain above, and the next resistance is at 26,310.45 (R2), which is the all-time high for the index. On the other hand, the closest support is now at 26,145 (S1), and the next one at 25,025 (S2), which were previous resistance now acting as support. If the index falls below this, the next strong support level to watch is at 25,855 (S3).
Trade Setup:
Nifty 50Resistance 226,310.45Resistance 126,248.35Closing Price26,215.55Support 126,145.00Support 226,025.00Support 325,855.00NIFTY 50 Momentum Indicators Analysis
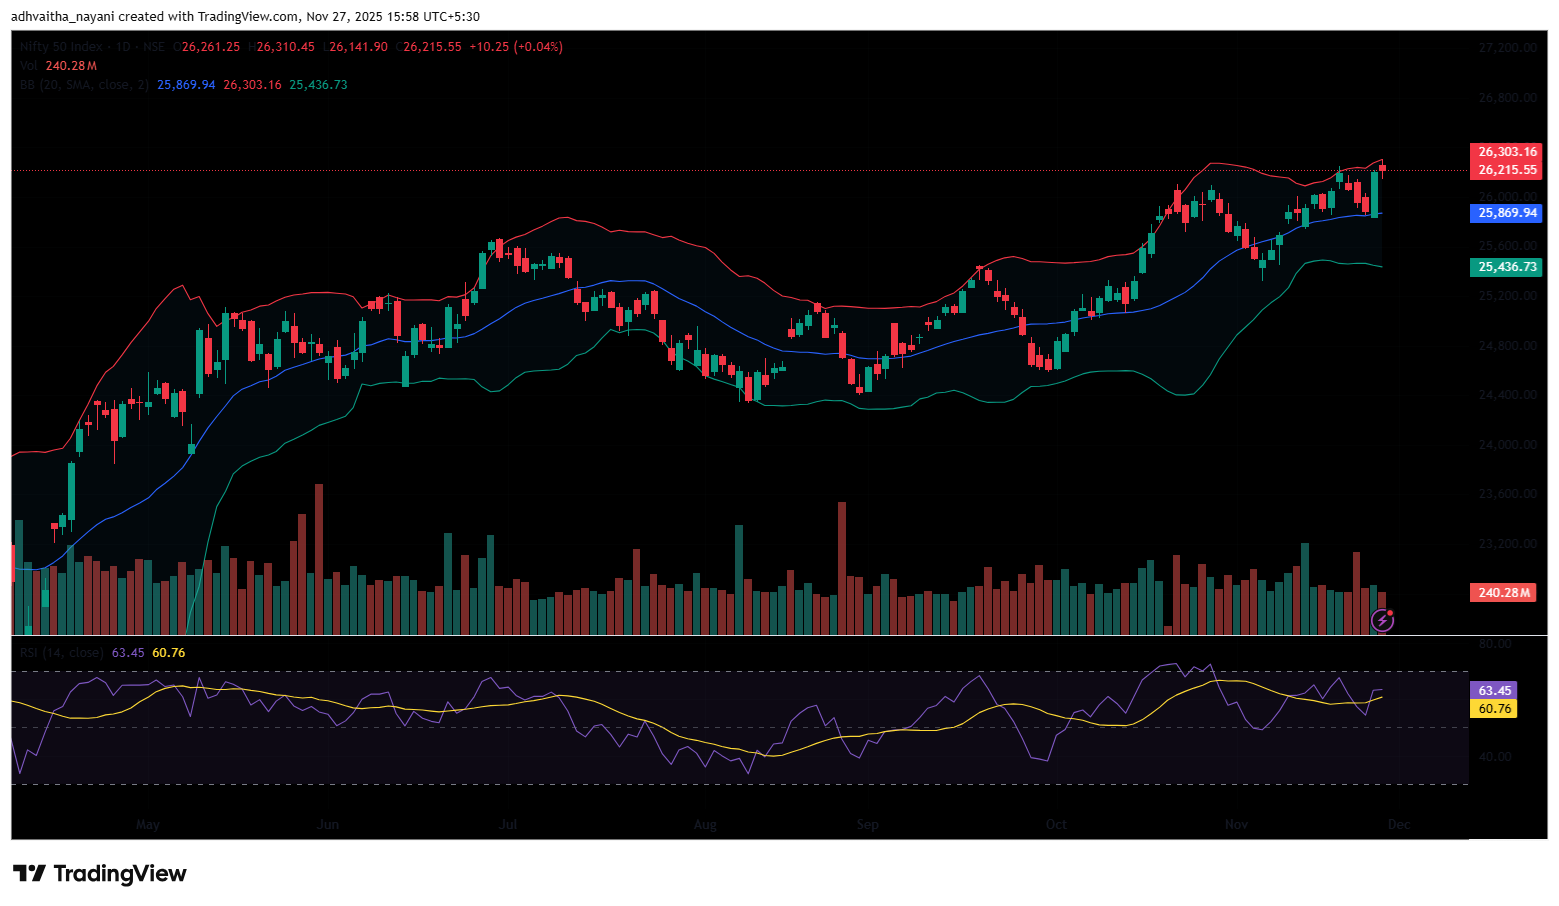
RSI (Daily): The Nifty 50’s RSI stood at 63.45, which is below the overbought zone of 70, indicating room to grow higher.
Bollinger Bands (Daily): The index is comfortably trading in the upper band of the Bollinger Band range. Its position in the upper range suggests a bullish sentiment in the short term. However, on Thursday’s session, the Index formed a doji-like candlestick pattern, which indicates indecisiveness. The index took support near 25,145 and sustained above the 26,200 level. A sustained move above the middle band signals a bullish sentiment, while a drop back toward the lower band may reinforce bearish sentiment.
Volume Analysis: Thursday’s trading session had an average volume of 240.29 Mn.
Derivatives Data: Options open interest (OI) data suggest a strong support zone around 26,100 and 26,200, where put option writing is high, indicating traders expect the index to hold these levels. On the upside, significant call option open interest at 26,300 and 26,400 signals resistance, as sellers are likely to defend these strike prices. The Put/Call Ratio (PCR) stands at 1.15, which is above 1 and indicates a neutral to bearish sentiment with more put activity than call. However, the presence of a long buildup, where traders aggressively increase their “long” positions (bets that a price will rise), adds buying pressure, making the overall outlook mixed. This combination implies the market may trade in a range, with strong support near 26,100-26,200 and resistance near 26,300-26,400, until a decisive breakout occurs.
Bank Nifty Chart & Price Action Analysis
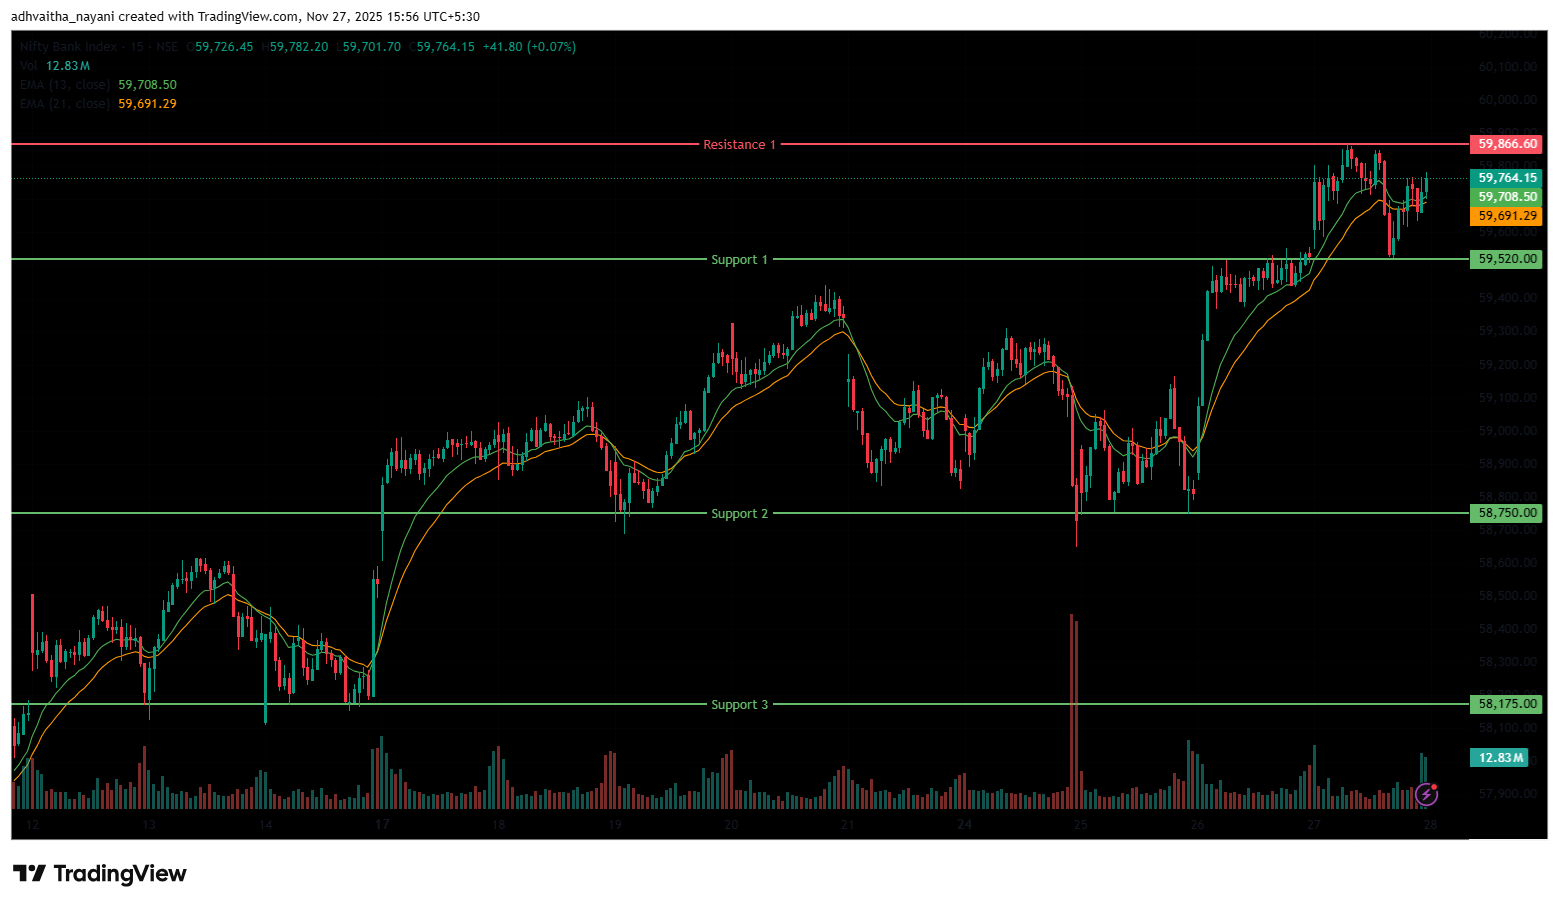
The Bank Nifty Index also opened on a positive note at 59,605.30, above the 59,600 level, on Thursday, up by 77.25 points from Wednesday’s closing of 59,528.05. During the morning session, the index moved upwards above 59,800, hitting a new all-time high of 59,866.60. But later, it was trading in a consolidated range between 59,720 and 59,850 levels. In the afternoon session, the index continued to trade in a range-bound manner and reached the day’s low at the 59,523 level.
It traded in the range of 59,550 and 59,800, ending the day near the 59,700 mark. Finally, it had closed on a bullish note at 59,737.3, surging 209.25 points or 0.35%. The Relative Strength Index (RSI) stood at 72.05, in the overbought zone of 70 in the daily time frame. In the short term, the Index was above the 13/20 day EMA in the daily time frame.
The nearest resistance is at 59,866.60 (R1), which is the all-time high for the index. On the other hand, the closest support is now at 59,520 (S1), and the next support is at 58,750 (S2), where the index has taken support at this level previously. If the index falls below this, the next major support level to watch is at 58,175 (S3).
Trade Setup:
Bank NiftyResistance 159,866.60Closing Price59,737.30Support 159,520.00Support 258,750.00Support 358,175.00BSE Sensex Chart & Price Action Analysis
To view other technical reports, click here
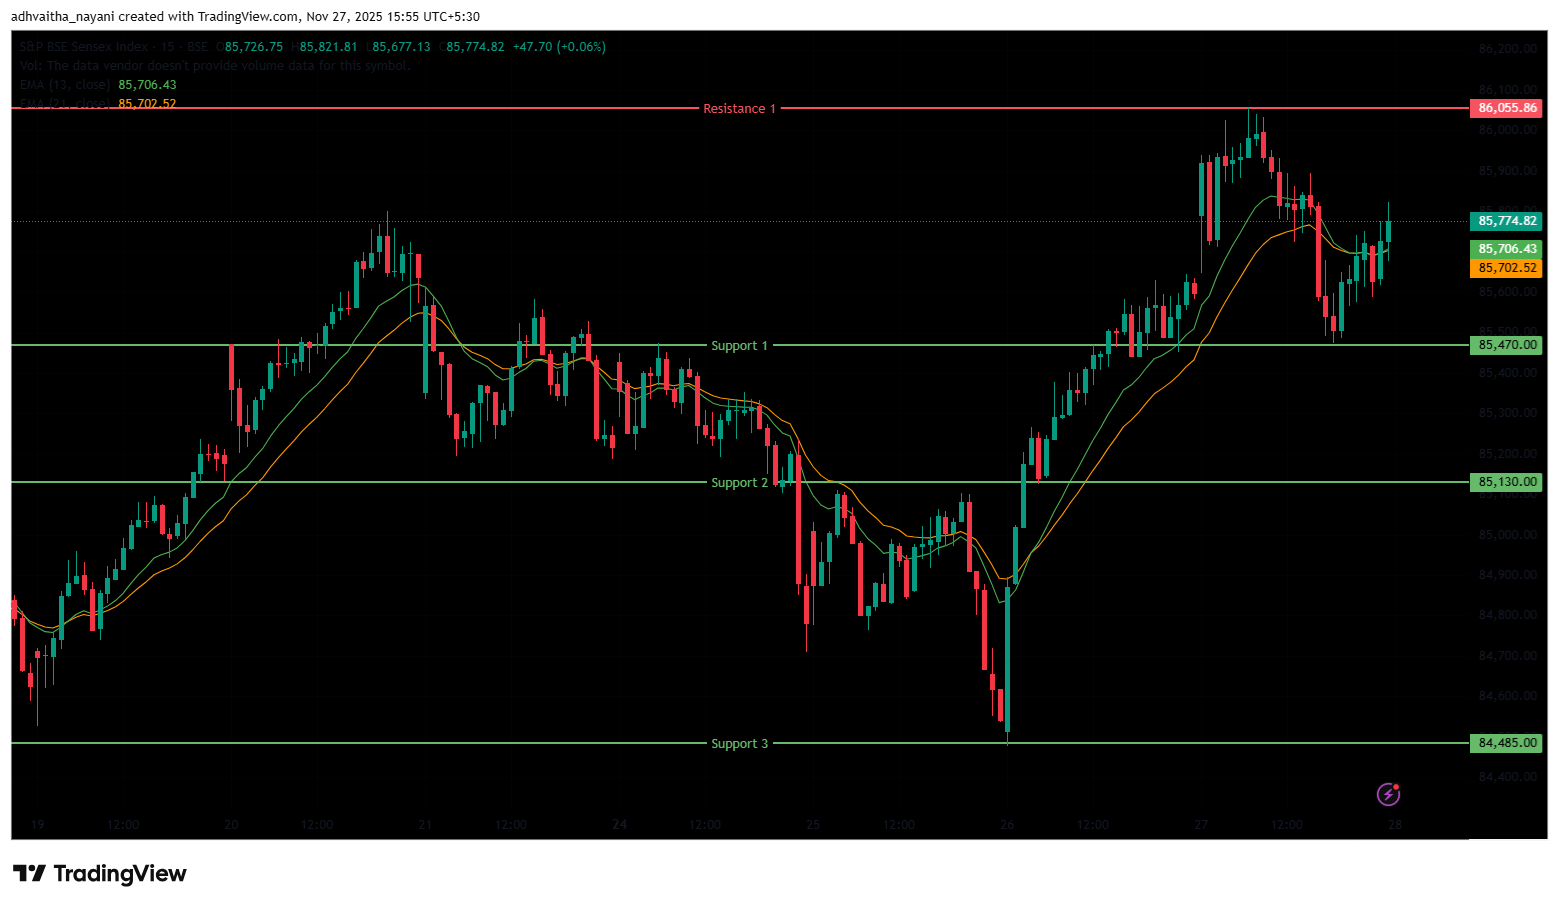
The BSE Sensex Index also opened on a similar note as the Nifty 50, opening at 85,745.05 on Thursday, up by 135.54 points from Wednesday’s closing of 85,609.51. The Sensex index opened on a positive note and hit an all-time high at 86,055.86, crossing the 86,000 mark during the morning session. It traded in the range of 85,720 and 86,000 during the morning session. In the afternoon session, the index started declining from its high and hit a day’s low at 85,473.85.
The Index was trading between the range of 85,500 and 85,850 during the afternoon session. Finally, it had closed at 85,720.38 in green, up 110.87 points or 0.13%. The Relative Strength Index (RSI) stood at 64.33, below the overbought zone of 70 in the daily time frame. In the short term, the Index was above the 13/20 day EMA in the daily time frame, and the index formed a Doji candlestick pattern, which suggests indecisiveness.
The index faces immediate resistance at 86,055.86 (R1), a level near its all-time high. On the downside, support lies at 85,470 (S1), which was previously resistance and now acts as support; the next one is at 85,130 (S2), where the index has taken support previously. Whereas the next support level (S3) is at 84,485.
Trade Setup:
SensexResistance 186,055.86Closing Price85,720.38Support 185,470.00Support 285,130.00Support 384,485.00Market Recap on November 27th, 2025
On Thursday, the Nifty 50 opened on a positive note at 26,261.25, up by 55.95 points from its previous close of 26,205.30. The index hit an all-time high of 26,310.45 and closed above the 26,200 level at 26,215.55, up 10.25 points, or 0.039%. The index closed above all key moving averages (20/50/100/200-day EMAs) on the daily chart. The BSE Sensex followed the same trajectory, opening on a positive trend at 85,745.05, up 135.54 points from the previous close of 85,609.51.
It closed at 85,720.38, up 110.88 points, or 0.13%. Both indices showed a high momentum, with RSI values for the Nifty 50 at 63.45 and the Sensex at 64.33, below the overbought threshold of 70 in the daily time frame. The broader indices remained flat to positive as Market participants are now closely watching tomorrow’s GDP numbers, along with important events like the US-India deal and the upcoming RBI policy meeting.
Sectoral indices ended on a mixed note on Thursday; major gainers were the Nifty Media index, which rose 0.84% or 12.15 points and stood at 1,460.2. Stocks such as Saregama India Ltd rose 5.1%, followed by Sun TV Network Ltd, which rose 3.4% and Tips Music Ltd, which increased by 2.5% on Thursday.
The Nifty Finance index was also among the highest gainers, increasing 0.53%, or 146.7 points, and standing at 27,946. Stocks such as Bajaj Finance Ltd rose 2.3%, followed by REC Ltd, BSE Ltd, and Shriram Finance Ltd, all of which rose by up to 1.6% on Thursday.
On the lagging side, the Nifty Oil & Gas Index fell 0.73%, or 89.55 points, to 12,118. Stocks such as ONGC Ltd, Oil India Ltd, and Indian Oil Corporation fell up to 1.5% on Thursday. Nifty Realty also fell 0.72%, or 6.55 points, to 904.9. Stocks such as Anant Raj Ltd fell 2.9%, followed by Sobha Ltd, which fell up to 2.2%, and Brigade Enterprises Ltd, which fell 1.4% on Thursday.
Asian markets have ended on a positive note on Thursday. China’s Shanghai Composite rose by 11.08 points, or 0.29%, to 3,875.26, while Japan’s Nikkei 225 jumped 608.03 points, or 1.23%, closing at 50,167.10. Hong Kong’s Hang Seng Index was slightly up 17.85 points, or 0.069%, to 25,945.93, and South Korea’s KOSPI advanced 26.04 points, or 0.66%, closing at 3,986.91.
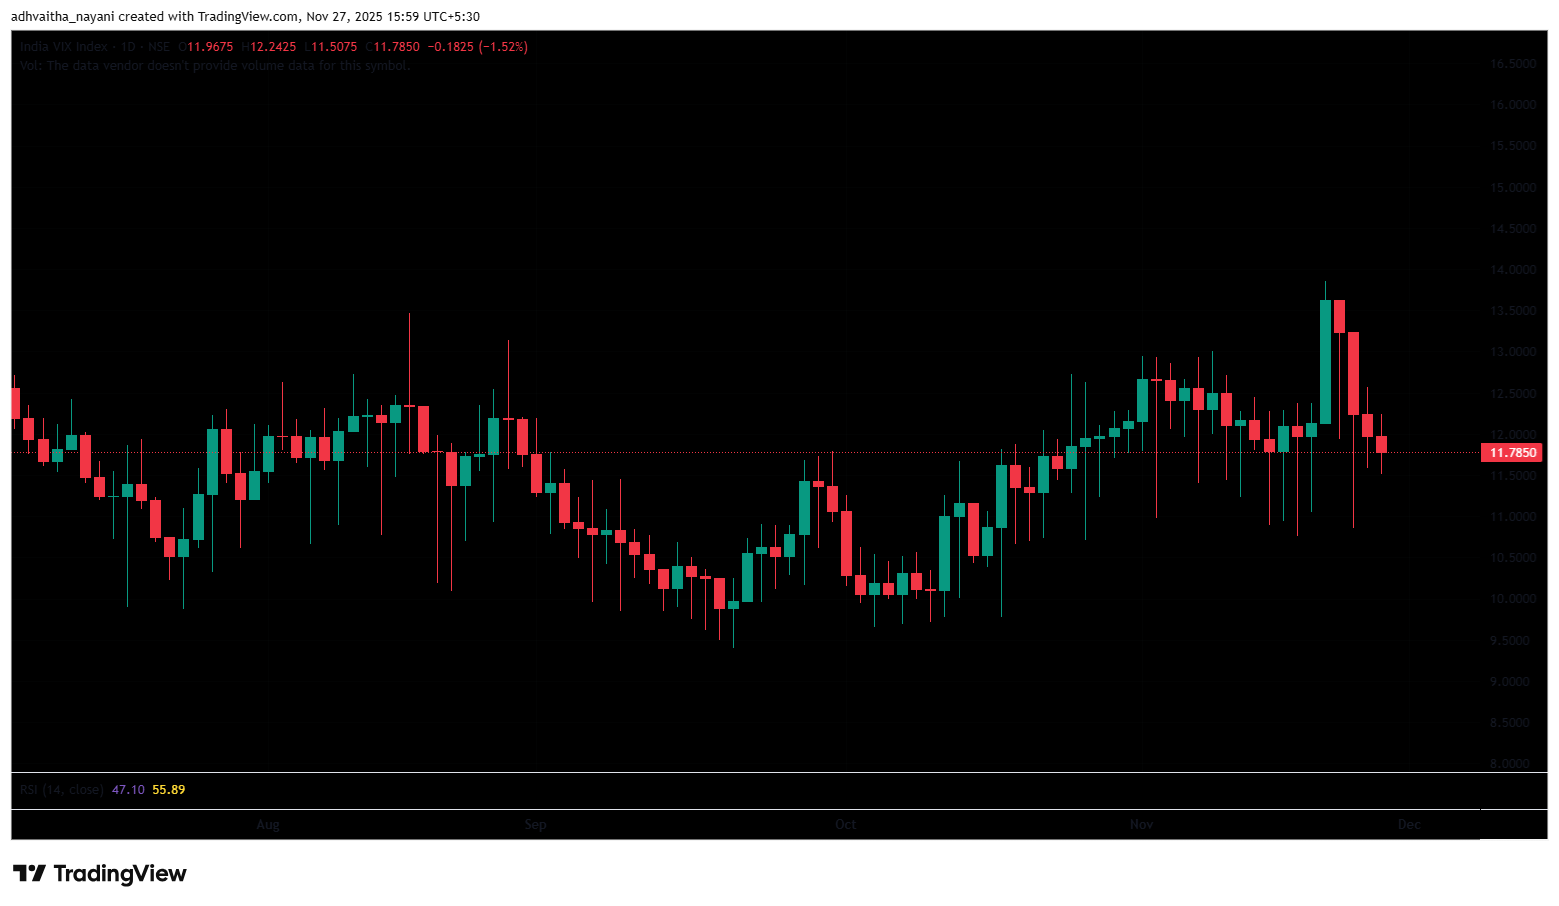
India VIX
The India VIX fell 0.18 points (1.52%) from 11.97 to 11.79 during Thursday’s session, indicating a downtrend in expected market volatility. However, overall volatility remains low, since the India VIX is generally considered elevated only when it rises above 15.
Given the ongoing volatility and mixed sentiments, it’s advisable to avoid aggressive positions and wait for clear directional moves above resistance or below support. Traders should consider these key support and resistance levels when entering long or short positions following the price break from these critical levels. Additionally, traders can combine moving averages to identify more accurate entry and exit points.
DisclaimerThe views and investment tips expressed by investment experts/broking houses/rating agencies on tradebrains.in are their own, and not that of the website or its management. Investing in equities poses a risk of financial losses. Investors must therefore exercise due caution while investing or trading in stocks. Trade Brains Technologies Private Limited or the author are not liable for any losses caused as a result of the decision based on this article. Please consult your investment advisor before investing.
About: Trade Brains Portal is a stock analysis platform. Its trade name is Dailyraven Technologies Private Limited, and its SEBI-registered research analyst registration number is INH000015729.
Investments in securities are subject to market risks. Read all the related documents carefully before investing.
Registration granted by SEBI and certification from NISM in no way guarantee performance of the intermediary or provide any assurance of returns to investors.
The post Technical View: Nifty, Bank Nifty & Sensex Trade Setup and Key levels to watch for 28th November appeared first on Trade Brains.
Related Articles

5 Stocks Recommended by Top Brokerages That Can Deliver Returns of Up to 45%
Synopsis: Five top brokerages have issued fresh Buy calls across IT, FMCG, trave...

₹3,200 Cr Order Book: Can This Smart Meter Stock Evolve Into an Electrical Solutions Co.?
Synopsis: HPL Electric delivered a record FY26, backed by strong smart meter dem...

Tata Motors: Can It Double Passenger Vehicle Volumes and Reach 20% Market Share by FY31?
Synopsis: Tata Motors targets strong PV growth with EV-led expansion, aiming to...

KPIT Technologies: Will Q1 Results Be Strong Enough For A Turnaround?
Synopsis: KPIT Technologies has spent the past year explaining why growth slowed...