Technical View: Nifty, Bank Nifty & Sensex Trade Setup and Key levels to watch for 3rd December
Alex Smith
6 months ago

The Nifty and Sensex extended their decline for a third consecutive session, weighed down by a weaker rupee, persistent foreign investor selling, and broad-based profit booking. Both benchmarks opened softer and ended lower, though Nifty continued to hold above its key moving averages. Momentum indicators for both indices stayed in a neutral-to-positive zone, suggesting moderate strength despite the pullback. Sectoral performance was largely negative, with financial-oriented indices, such as finance, private banking, and the broader banking gauge, facing the sharpest pressure due to declines in major banking names and exchanges.
In contrast, select defensive and multinational-linked segments displayed resilience. The MNC index stood out as the primary gainer, supported by strength in consumer-focused, engineering, and pharmaceutical companies. The pharma index also ended marginally positive, driven by buying interest across several key drug manufacturers. Across Asia, market sentiment remained generally constructive, with most regional markets closing on a positive note, although China saw a mild dip. While global cues were supportive, domestic factors limited the upside for Indian equities during the session.
In this overview, we will analyse the key technical levels and trend directions for Nifty and BSE Sensex to monitor in the upcoming trading sessions. All the charts mentioned below are based on the 15-minute timeframe.
NIFTY 50 Chart & Price Action Analysis
To view other technical reports, click here
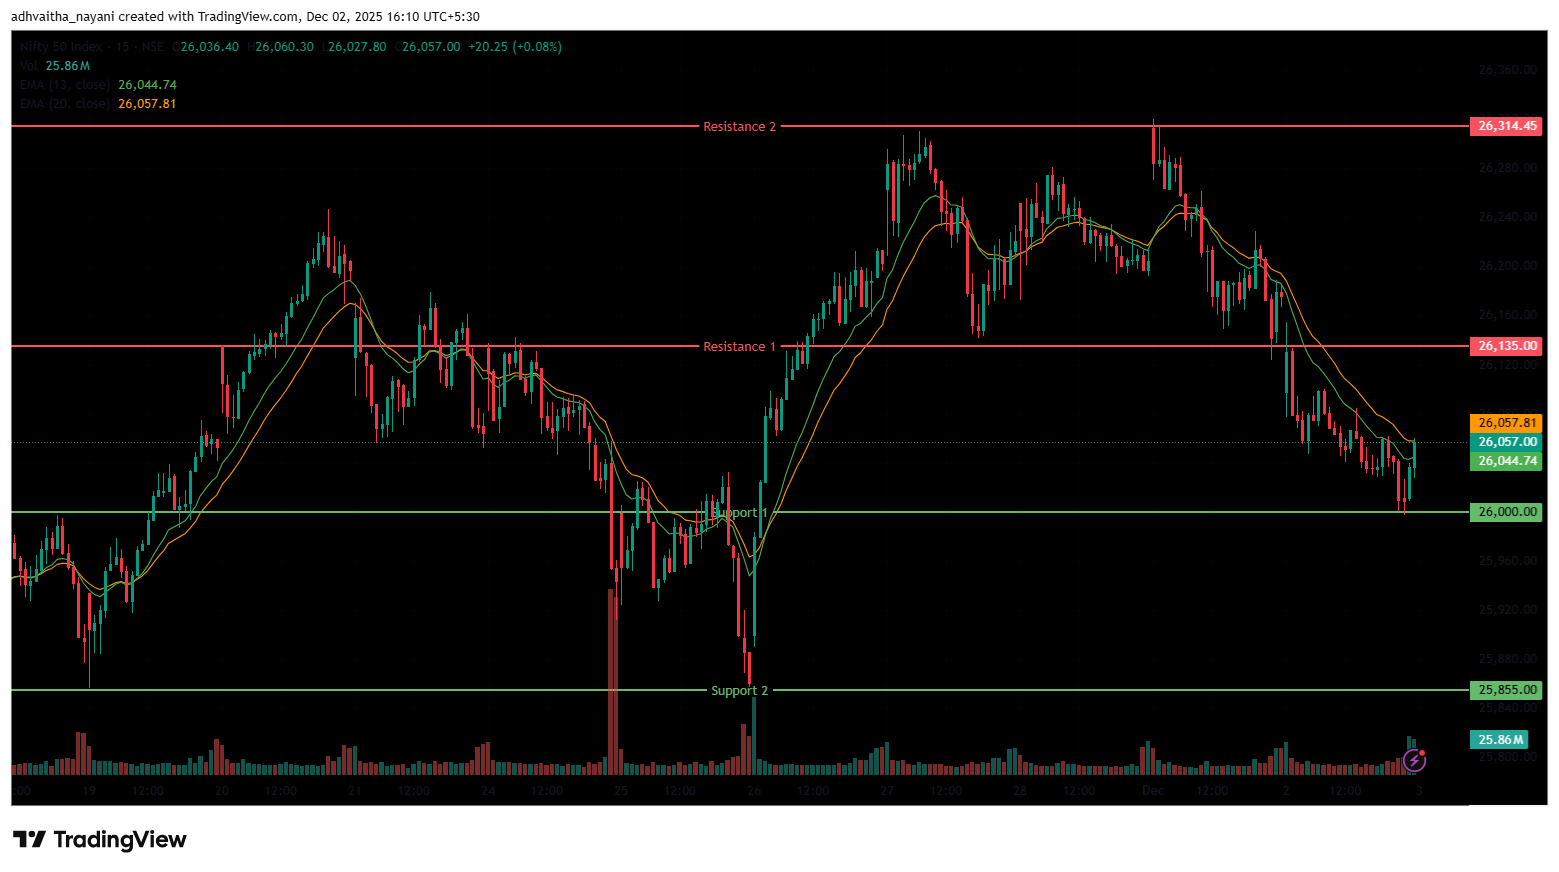
The Nifty 50 Index opened on a negative note at 26,087.95 on Tuesday, down by 87.8 points from Monday’s closing of 26,175.75. During the weekly expiry, the index continued to falter in the morning session and fell below the 26,100 level. It was trading within the range of 26,040 and 26,120. The index had peaked at 26,154.60.
In the afternoon session, the index dropped further, falling to the 26,000 level, hitting an intraday low at 25,997.85. The Index was trading between the range of 26,000 and 26,080. Finally, it had closed on a negative note at 26,032.20, down by 143.55 points, or 0.55%. In the short term, the Index was above the 20-day EMA but fell below the 13-day, indicating a cautious outlook in the daily time frame.
The Nifty 50’s nearest resistance level is 26,135 (R1), the level at which it failed to sustain above, and its next resistance is at 26,314.45 (R2). On the other hand, the closest support is now at 26,000 (S1), and the next one at 25,855 (S2), which were previous resistances now acting as support.
Trade Setup:
Nifty 50Resistance 226,314.45Resistance 126,135.00Closing Price26,032.20Support 126,000.00Support 225,855.00NIFTY 50 Momentum Indicators Analysis
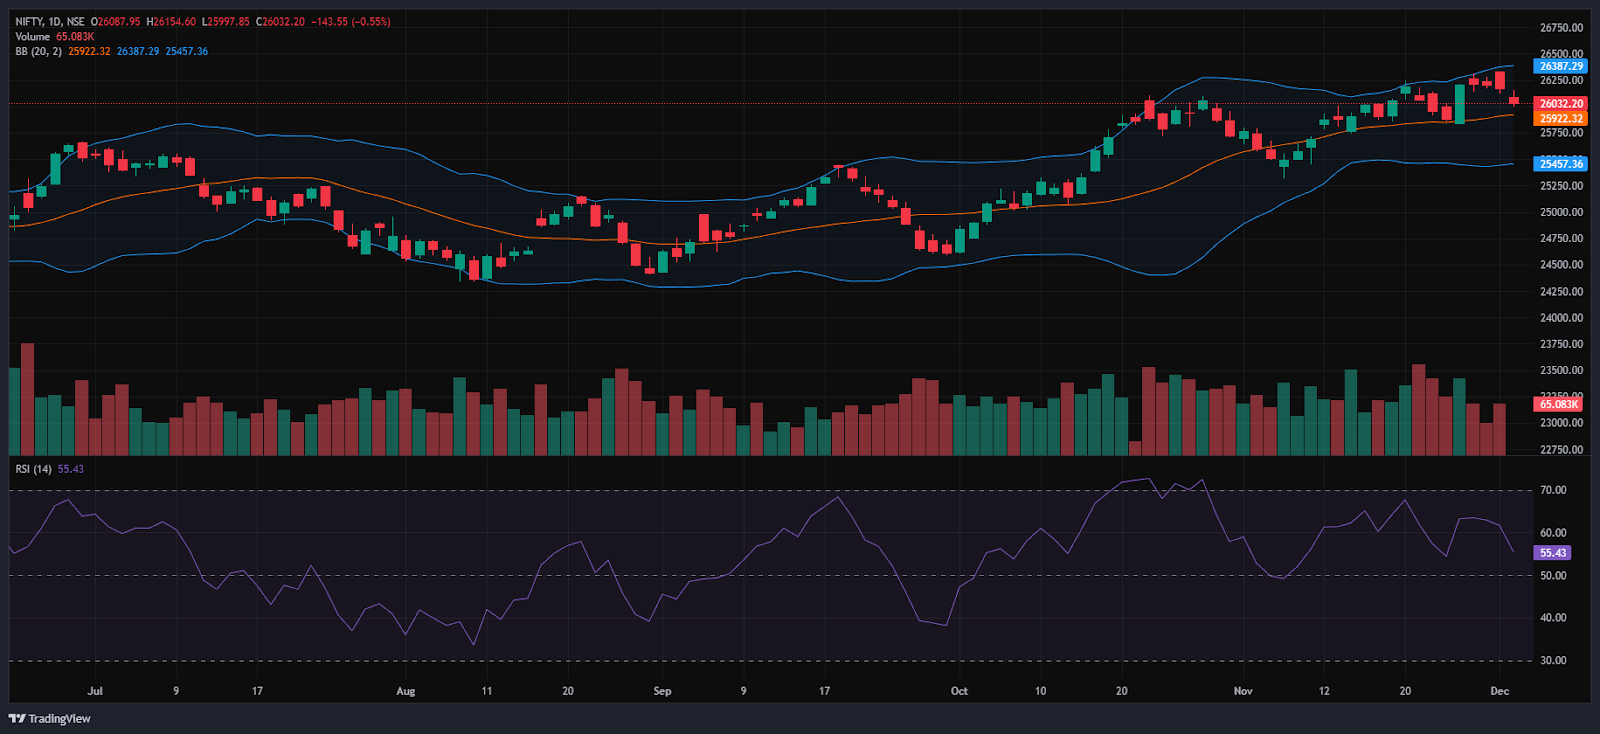
RSI (Daily): The Nifty 50’s RSI stood at 55.43, which is below the overbought zone of 70, indicating room to grow higher.
Bollinger Bands (Daily): The index is trading in the upper band of the Bollinger Band range, and nearing the middle band. Its position in the upper range suggests a bullish sentiment in the short term. However, on Tuesday’s session, the Index formed a bearish candlestick pattern, with a longer upper wick and a smaller lower wick, with a red body, reflecting weakness. The index fell below the 26,100 level on Tuesday’s session, and was hovering near the 26,000 level. A sustained move above the middle band signals a bullish sentiment, while a drop back toward the lower band may reinforce bearish sentiment.
Volume Analysis: Tuesday’s trading session had an average volume of 254.8 Mn.
Derivatives Data: Options open interest (OI) data suggest a strong support zone around 26,000 and 25,950, where put option writing is high, indicating traders expect the index to hold these levels. On the upside, significant call option open interest at 26,050 and 26,100 signals resistance, as sellers are likely to defend these strike prices. The Put/Call Ratio (PCR) stands at 0.73, which is below 1 and indicates a neutral to bullish sentiment with more call activity than put. The presence of a long buildup indicates a bullish sentiment and a likely reversal of the downward trend, as traders initiate new long positions in anticipation of a price increase. This combination implies the market may trade in a range, with strong support near 26,000-25,950 and resistance near 26,050-26,100, until a decisive breakout occurs.
Bank Nifty Chart & Price Action Analysis
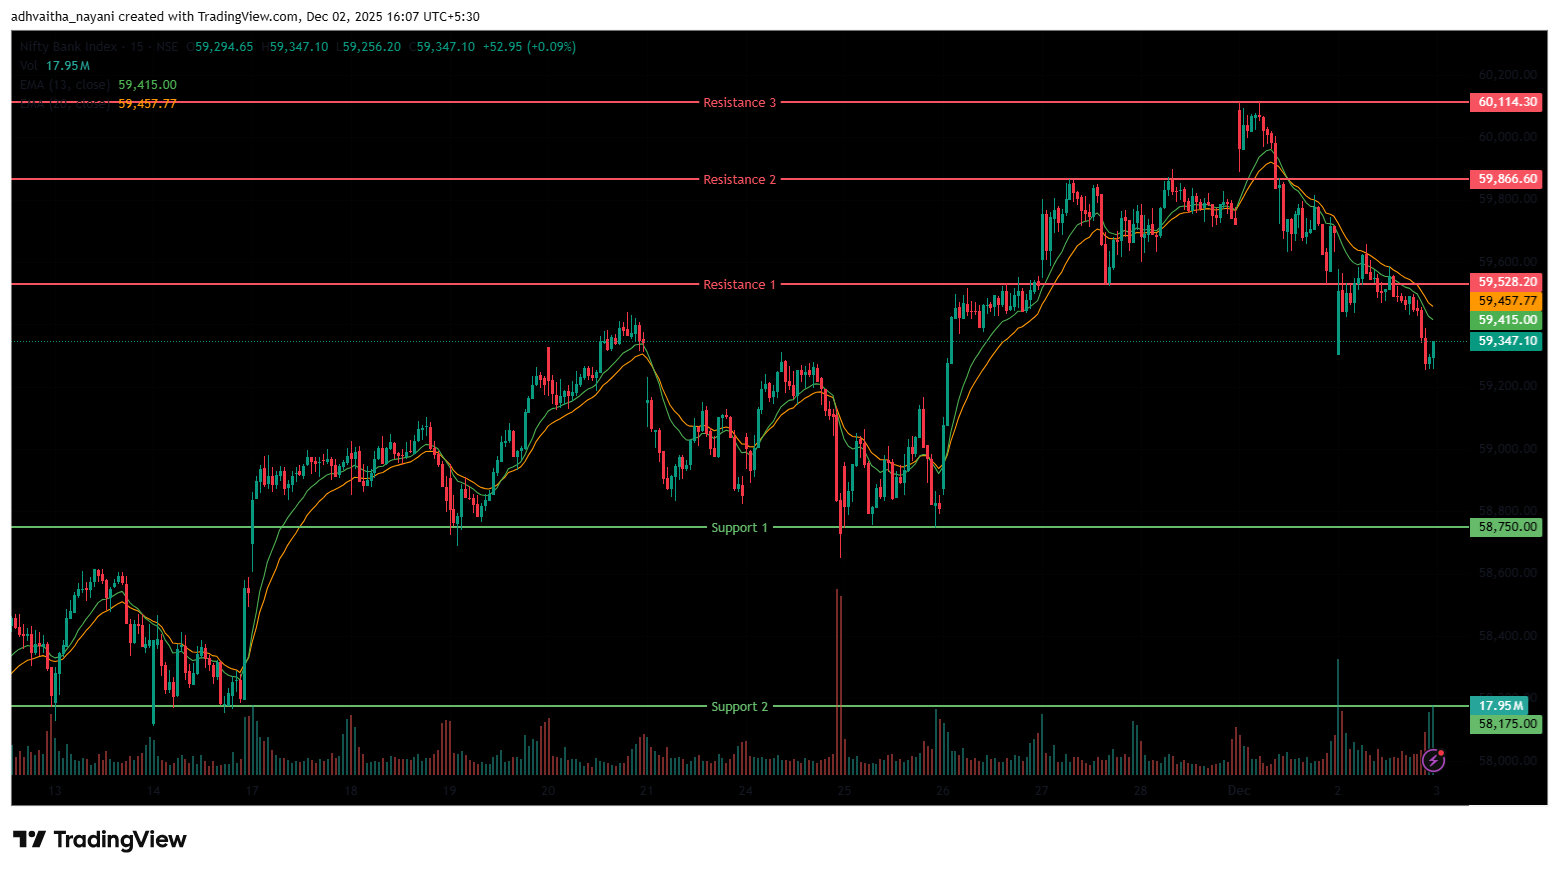
The Bank Nifty Index also opened on a negative note at 59,354.20, below the 59,400 level, on Tuesday, down by 327.15 points from Monday’s closing of 59,681.35. During the morning session, the index opened on a gap down near the 59,350 mark and later moved upwards above 59,600, hitting a day’s high of 59,656.55. But later the index plunged below the 59,600 level, and it was trading in a range between the 59,400 and 59,650 levels.
In the afternoon session, the index was further dragged down to the 59,250 mark, hitting a day’s low at 59,251.95 and trading in the range of 59,250 and 59,550, ending the day below the 59,300 mark. Finally, it had closed on a bearish note at 59,273.80, down by 407.55 points or 0.68%. The Relative Strength Index (RSI) stood at 61.7, below the overbought zone of 70 in the daily time frame. In the short term, the Index was above the 13/20 day EMA in the daily time frame.
The nearest resistance is at 59,528.20 (R1) and 59,866.60 (R2). The higher resistance is at 60,114.30 (R3), which is the all-time high for the index. On the other hand, the closest support is now at 58,750 (S1), and the next support is at 58,175 (S2), where the index has taken support at this level previously.
Trade Setup:
Bank NiftyResistance 360,114.30Resistance 259,866.60Resistance 159,528.20Closing Price59,273.80Support 158,750.00Support 258,175.00BSE Sensex Chart & Price Action Analysis
To view other technical reports, click here
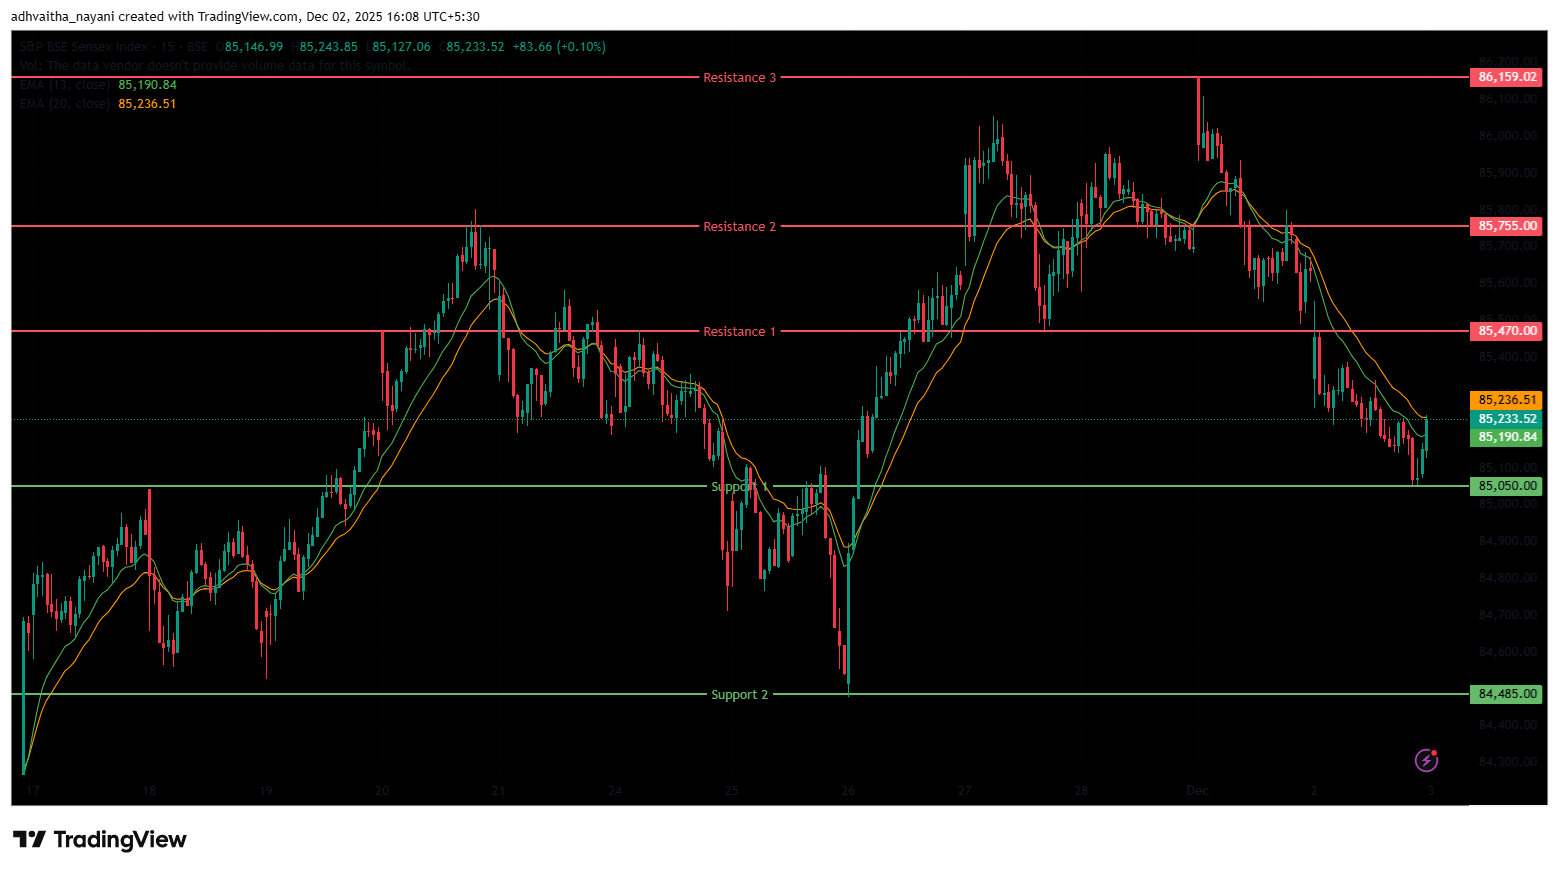
The BSE Sensex Index also opened on a similar note as the Nifty 50, opening at 85,325.51 on Tuesday, down by 316.39 points from Monday’s closing of 85,641.90. The Sensex index started the session on a gap-down note near the 85,300 mark. It traded in the range of 85,200 and 85,550 during the morning session. In the afternoon session, the index continued declining from its high and reached the 85,050 mark.
The Index was trading between the range of 85,050 and 85,300 during the afternoon session. Finally, it had closed at 85,138.27 in red, down 503.62 points or 0.59%. The Relative Strength Index (RSI) stood at 56.41, below the overbought zone of 70 in the daily time frame. In the short term, the Index was above the 13/20 day EMA in the daily time frame but near to the 13-day EMA indicates a cautious outlook, and the index formed a Bearish candlestick pattern, which suggests a bearish trend.
The index faces immediate resistance at 85,470 (R1) and 85,755 (R2). The higher resistance is at 86,159.02 (R3), a level near its all-time high. On the downside, support lies at 85,050 (S1), which was previously resistance and now acts as support; the next one is at 84,485 (S2).
Trade Setup:
SensexResistance 386,159.02Resistance 285,755.00Resistance 185,470.00Closing Price85,138.27Support 185,050.00Support 284,485.00Market Recap on December 2nd, 2025
On Tuesday, the Nifty 50 opened lower at 26,087.95, down by -87.8 points from its previous close of 26,175.75. The index hit an intraday low of 25,997.85 and closed below the 26,100 level at 26,032.2, down -143.55 points, or -0.55%. The index closed above all key moving averages (20/50/100/200-day EMAs) on the daily chart. The BSE Sensex followed the same trajectory, opening on a positive trend at 85,325.51, down -316.39 points from the previous close of 85,641.9.
It closed at 85,138.27, down -503.62 points, or -0.59%. Both indices showed moderate momentum, with RSI values for the Nifty 50 at 55.43 and the Sensex at 56.41, nearing the overbought threshold of 70. The major indices extended a fall for the third consecutive day on Tuesday as weakness in the rupee, continued FIIs selling and profit bookings pressured the investor sentiment.
On Tuesday, most of the indices remained losers except for two major gainers, which were the Nifty MNC index, which rose 0.3% or 99.5 points, and stood at 30,601.60. Stocks such as United Breweries Ltd rose 3%, followed by Hitachi Energy India Ltd and Gland Pharma Ltd, which increased by up to 2.6% on Tuesday.
The Nifty Pharma index was also among the biggest gainers, increasing 0.1% or 17.25 points, and standing at 22,905. Stocks such as Gland Pharma Ltd, Glenmark Pharmaceuticals Ltd, Wockhardt Ltd, and Dr Reddy’s Laboratories Ltd all rose by up to 1.9% on Tuesday.
On the other hand, the Nifty Finance index was the major loser, falling -0.90% or -249.25 points, and standing at 27,565. Stocks such as BSE Ltd fell by -1.5%, followed by Axis Bank Ltd and ICICI Bank Ltd, which decreased by up to -1.39% on Tuesday. The Nifty Private Bank index was also among the biggest losers, falling -0.69% or -199.85 points, and standing at 28,558.
Stocks such as RBL Bank Ltd were down -1.56% on Tuesday. While other stocks like Axis Bank Ltd, ICICI Bank Ltd, and HDFC Bank Ltd also decreased by up to -1.39%. The Nifty Bank index was also among the top losers, falling -0.68% or -407.55 points, and standing at 59,273.
Asian markets ended the day on a positive note. Japan’s Nikkei 225 up by 39.72 points or 0.08%, closing at 49,303.28; China’s Shanghai Composite declined by -16.30 points, or -0.42%, to 3,897.71. Whereas, Hong Kong’s Hang Seng Index increased by 31.74 points, or 0.12%, to close at 26,065.00, and South Korea’s KOSPI also increased by 74.56 points, or 1.87%, closing at 3,994.93.
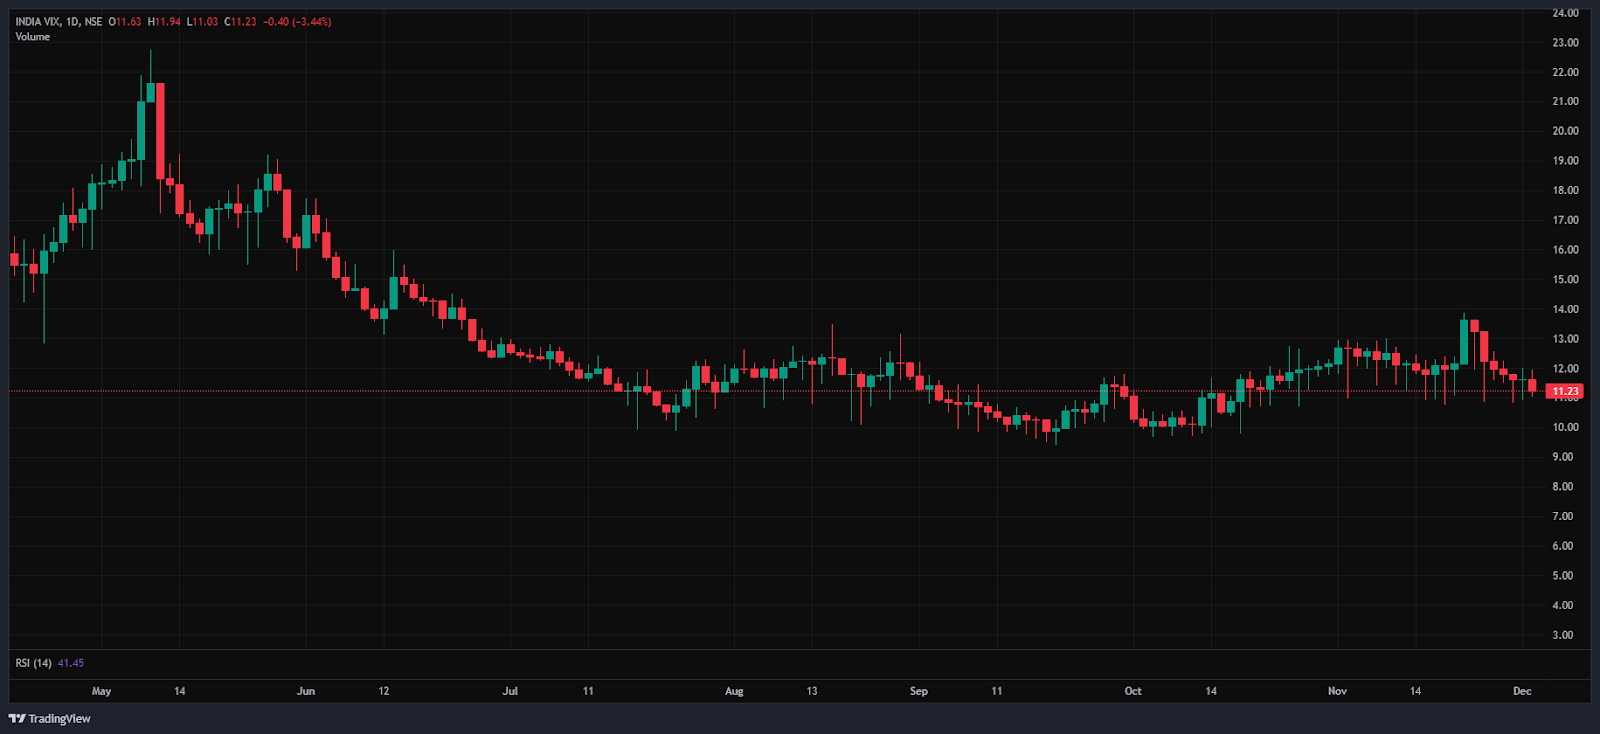
India VIX
The India VIX fell to 11.23, down by 0.40 points (3.42%) during Tuesday’s trading session, indicating stable sentiment in expected market volatility. However, overall volatility remains low, since the India VIX is generally considered elevated only when it rises above 15.
Given the ongoing volatility and mixed sentiments, it’s advisable to avoid aggressive positions and wait for clear directional moves above resistance or below support. Traders should consider these key support and resistance levels when entering long or short positions following the price break from these critical levels. Additionally, traders can combine moving averages to identify more accurate entry and exit points.
DisclaimerThe views and investment tips expressed by investment experts/broking houses/rating agencies on tradebrains.in are their own, and not that of the website or its management. Investing in equities poses a risk of financial losses. Investors must therefore exercise due caution while investing or trading in stocks. Trade Brains Technologies Private Limited or the author are not liable for any losses caused as a result of the decision based on this article. Please consult your investment advisor before investing.
About: Trade Brains Portal is a stock analysis platform. Its trade name is Dailyraven Technologies Private Limited, and its SEBI-registered research analyst registration number is INH000015729.
Investments in securities are subject to market risks. Read all the related documents carefully before investing.
Registration granted by SEBI and certification from NISM in no way guarantee performance of the intermediary or provide any assurance of returns to investors.
The post Technical View: Nifty, Bank Nifty & Sensex Trade Setup and Key levels to watch for 3rd December appeared first on Trade Brains.
Related Articles

Hidden Gems: 4 Stocks With Dominant Positions in Global Markets
Synopsis:- From high-chrome grinding media to aquaculture cages, plant-derived s...

3 Defence Stocks That Could Benefit From India’s ₹70,000 Cr Submarine Programme
Synopsis: India’s long-awaited Rs. 70,000 crore Project-75(I) submarine pr...

Aastha Spintex IPO: From Issue Details to Financials; Here’s What You Need to Know
Synopsis: Aastha Spintex Limited’s ₹170 crore IPO opens on June 29, 2026. Backed...
4 Defence Electronic Stocks That Are Tied to India’s Space Surveillance Build-Out
Synopsis: As India channels defence budget allocations toward satellite-based su...