Technical View: Nifty, Bank Nifty & Sensex Trade Setup and Key levels to watch for 4th December
Alex Smith
5 months ago

Domestic equity benchmarks opened on a weaker note on Wednesday and extended their decline for a fourth straight session, reflecting cautious investor sentiment. Despite trading above key moving averages, both major indices struggled to sustain early gains as the local currency touched a record low, prompting continued foreign outflows and profit booking. Momentum indicators hovered in neutral territory, suggesting neither strong bullish nor bearish conviction, while overall market tone remained subdued.
Sectoral performance showed a clear divergence in sentiment. Information technology and private banking stocks attracted renewed buying interest, supported by optimism around global demand and stable earnings prospects. In contrast, public-sector banks and defence-related stocks faced notable pressure amid concerns about asset quality and valuation fatigue. Broader Asian markets also displayed a mixed undertone, with gains in some regions supported by expectations of policy easing, while others weakened on signs of slowing economic activity, adding to global uncertainty.
In this overview, we will analyse the key technical levels and trend directions for Nifty and BSE Sensex to monitor in the upcoming trading sessions. All the charts mentioned below are based on the 15-minute timeframe.
NIFTY 50 Chart & Price Action Analysis
To view other technical reports, click here
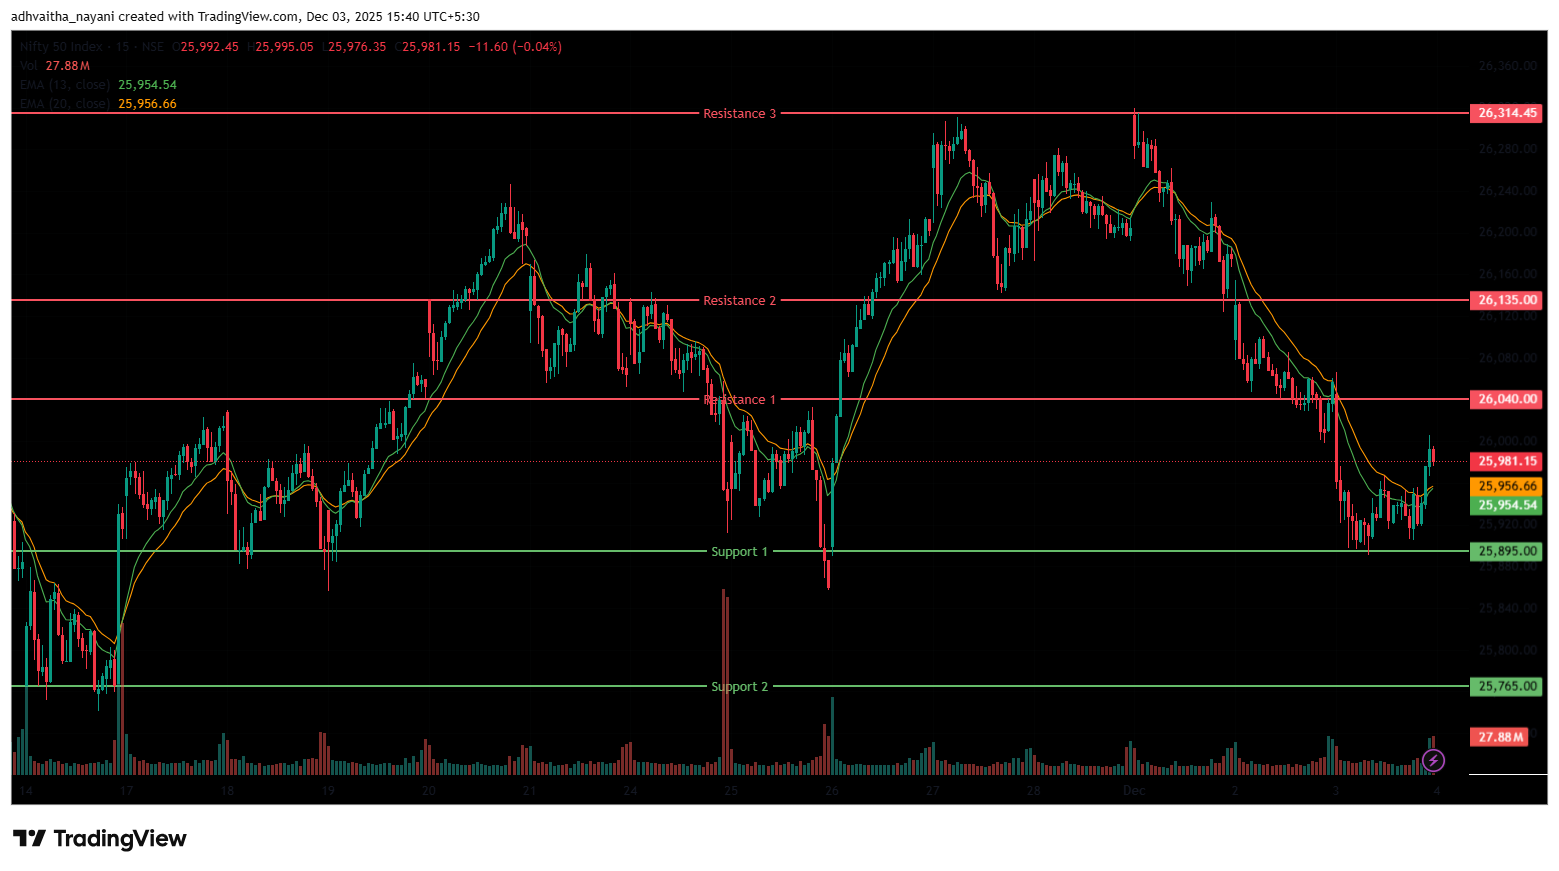
The Nifty 50 Index opened on a flat to negative note at 26,004.90 on Wednesday, down by 27.3 points from Tuesday’s closing of 26,032.20. The index started the session on a bearish note and opened at the 26,000 level. The Index hit its day’s low near the 25,891 mark, below the 25,900 level in the morning session. It was trading within the range of 25,900 and 25,950.
In the afternoon session, the index regained its momentum and was trading above the 25,950 mark. The Index was trading between the range of 25,900 and 26,000. Finally, it had closed on a negative note at 25,986.00, down by 46.20 points, or 0.18%. In the short term, the Index was above the 20-day EMA but fell below the 13-day, indicating a cautious outlook in the daily time frame.
The Nifty 50’s nearest resistance levels are at 26,040 (R1) and 26,135 (R2), the level at which it failed to sustain above, and its next resistance is at 26,314.45 (R3). On the other hand, the closest support is now at 25,895 (S1), and the next one at 25,765 (S2), which were previous resistances now acting as support.
Trade Setup:
Nifty 50Resistance 326,314.45Resistance 226,135.00Resistance 126,040.00Closing Price25,986.00Support 125,895.00Support 225,765.00NIFTY 50 Momentum Indicators Analysis
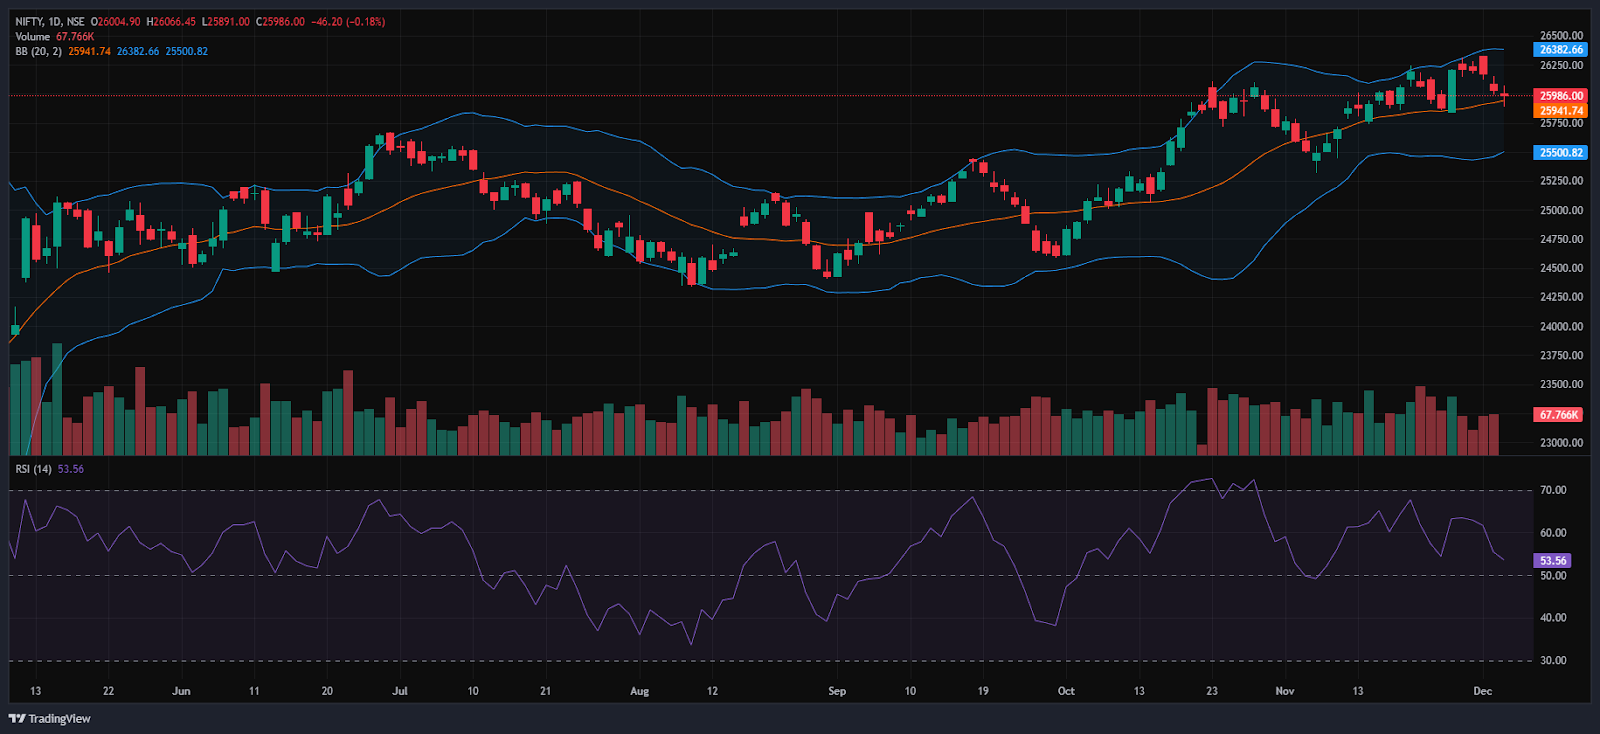
RSI (Daily): The Nifty 50’s RSI stood at 53.56, which is below the overbought zone of 70, indicating room to grow higher.
Bollinger Bands (Daily): The index is trading in the upper band of the Bollinger Band range and nearing the middle band. Its position in the upper range suggests a bullish sentiment in the short term. However, on Wednesday’s session, the Index formed a bearish candlestick pattern, with a longer wick on both sides, indicating indecisiveness. The index fell below the 26,000 level on Wednesday’s session and was hovering near the 25,990 level. A sustained move above the middle band signals a bullish sentiment, while a drop back toward the lower band may reinforce bearish sentiment.
Volume Analysis: Wednesday’s trading session had an average volume of 265.66 Mn.
Derivatives Data: Options open interest (OI) data suggest a strong support zone around 25,800 and 25,900, where put option writing is high, indicating traders expect the index to hold these levels. On the upside, significant call option open interest at 26,000 and 26,100 signals resistance, as sellers are likely to defend these strike prices. The Put/Call Ratio (PCR) stands at 0.69, which is below 1 and indicates a neutral to bullish sentiment with more call activity than put. The presence of a long buildup indicates a bullish sentiment and a likely reversal of the downward trend, as traders initiate new long positions in anticipation of a price increase. This combination implies the market may trade in a range, with strong support near 25,800-25,900 and resistance near 26,000-26,100, until a decisive breakout occurs.
Bank Nifty Chart & Price Action Analysis
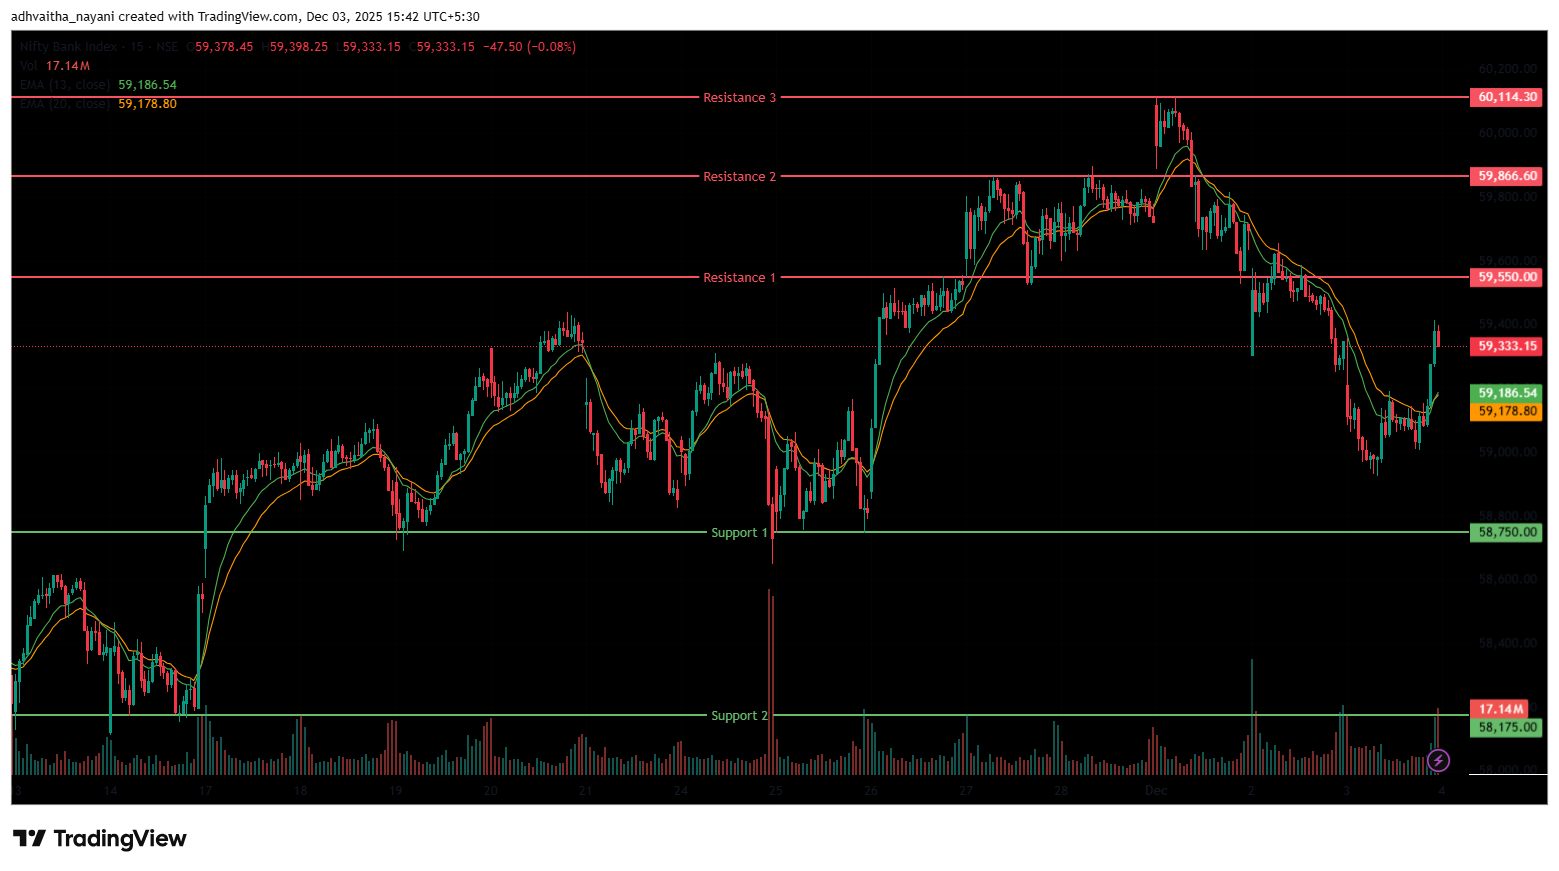
The Bank Nifty Index also opened on a negative note at 59,158.70, below the 59,200 level, on Wednesday, down by 115.1 points from Tuesday’s closing of 59,273.80. During the morning session, the index was trading in a range-bound manner after opening on a negative note and hitting an intraday low of 58,925.70, falling below the 59,000 level. It was trading in a range between the 59,000 and 59,200 levels.
In the afternoon session, however, the index rebounded from the day’s low and peaked at 59,414.90. It reversed the morning’s session loss and was trading in the range of 59,050 and 59,400, ending the day below the 59,400 mark. Finally, it had closed in green at 59,348.25, up by 74.45 points or 0.13%. The Relative Strength Index (RSI) stood at 62.62, below the overbought zone of 70 in the daily time frame. In the short term, the Index was above the 13/20 day EMA in the daily time frame.
The nearest resistance is at 59,550.00 (R1) and 59,866.60 (R2). The higher resistance is at 60,114.30 (R3), which is the all-time high for the index. On the other hand, the closest support is now at 58,750 (S1), and the next support is at 58,175 (S2), where the index has taken support at this level previously.
Trade Setup:
Bank NiftyResistance 360,114.30Resistance 259,866.60Resistance 159,550.00Closing Price59,348.25Support 158,750.00Support 258,175.00BSE Sensex Chart & Price Action Analysis
To view other technical reports, click here
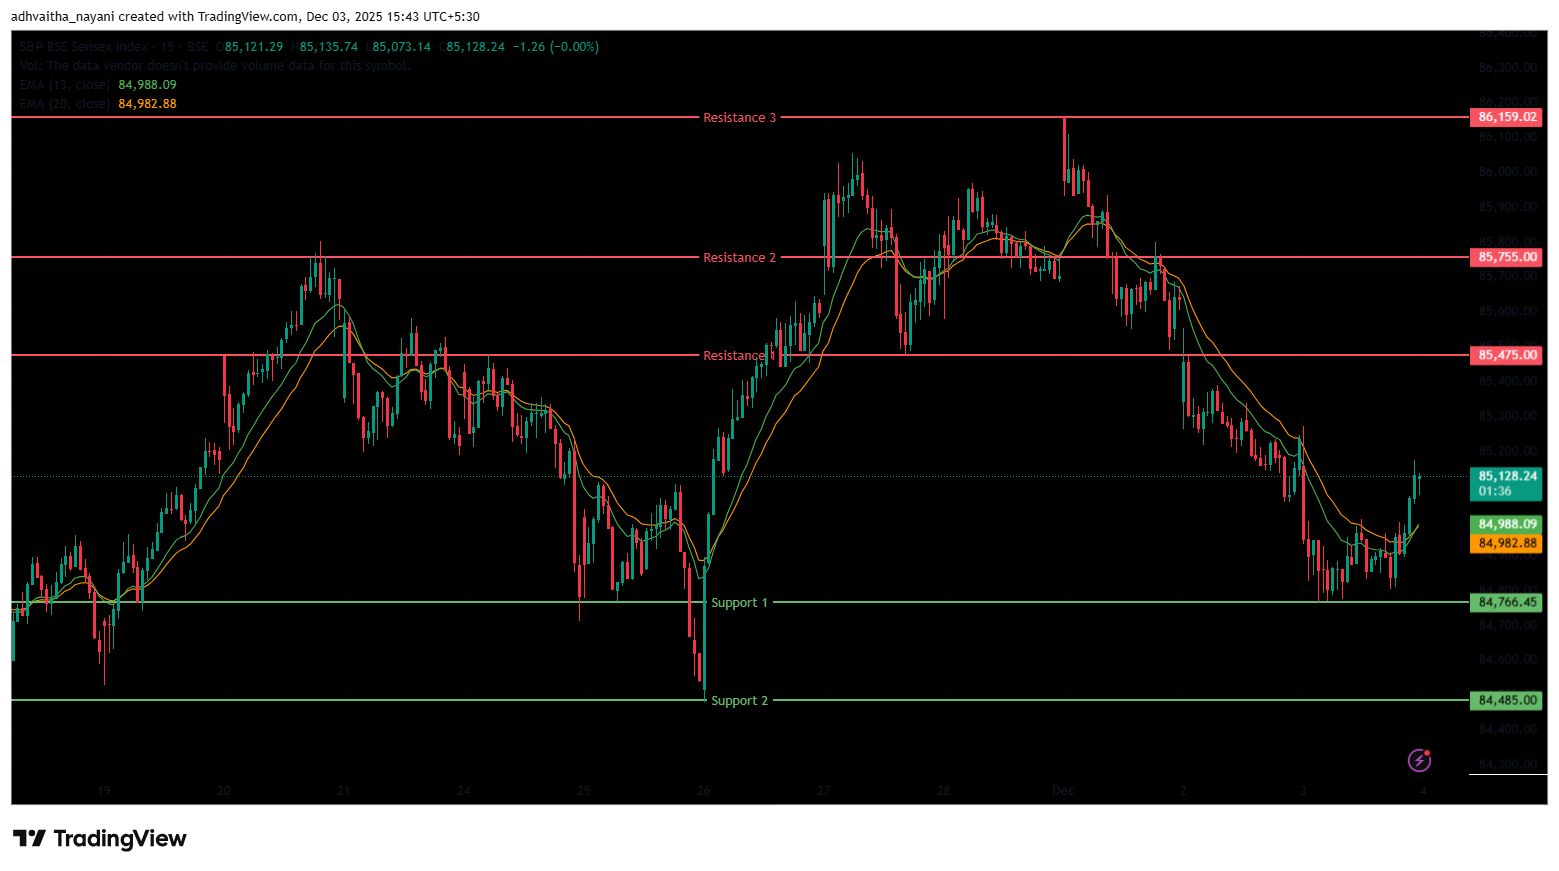
The BSE Sensex Index also opened on a flat note, opening at 85,150.64 on Wednesday, up by 12.37 points from Tuesday’s closing of 85,138.27. The Sensex index started the session on a flat-to-positive note above the 85,150 mark. It traded in the range of 84,800 and 85,000 during the morning session. The index was trading in a declining trend during the morning session, hitting the day’s low at 84,763.64, falling below the 85,000 mark. In the afternoon session, the index, however, rebounded and peaked at 85,269.68.
The Index was trading between the range of 84,800 and 85,100 during the afternoon session. Finally, it had closed at 85,106.81 on a flatter note, down 31.46 points or 0.04%. The Relative Strength Index (RSI) stood at 56, below the overbought zone of 70 in the daily time frame. In the short term, the Index was above the 20 day EMA in the daily time frame but below the 13-day EMA, indicating a cautious outlook, and the index formed a doji-like candlestick pattern, which suggests indecisiveness.
The index faces immediate resistance at 85,475 (R1) and 85,755 (R2). The higher resistance is at 86,159.02 (R3), a level near its all-time high. On the downside, support lies at 84,766.45 (S1), which was previously resistance and now acts as support; the next one is at 84,485 (S2).
Trade Setup:
SensexResistance 386,159.02Resistance 285,755.00Resistance 185,475.00Closing Price85,106.81Support 184,766.45Support 284,485.00Market Recap on December 3rd, 2025
On Wednesday, the Nifty 50 opened lower at 26,004.90, down by -27.3 points from its previous close of 26,032.20. The index hit an intraday low of 25,891 and closed below the 26,000 level at 25,986, down -46.20 points, or -0.18%. The index closed above all key moving averages (20/50/100/200-day EMAs) on the daily chart. The BSE Sensex followed the same trajectory, opening on a positive trend at 85,150.64, up 12.37 points from the previous close of 85,138.27.
It closed at 85,106.81, down -31.46 points, or -0.037%. Both indices showed moderate momentum, with RSI values for the Nifty 50 at 53.56 and the Sensex at 56, nearing the overbought threshold of 70. The major indices extended a fall for the fourth consecutive day on Wednesday as the rupee hit a record low at 90 per dollar; continued FII selling and profit bookings pressured the investor sentiment.
On Wednesday, major gainers were the Nifty IT index, which rose 0.8% or 284 points and stood at 37,825.25. Stocks such as Wipro Ltd rose 0.8%, followed by TCS Ltd and Infosys Ltd, which increased by up to 1.8% on Wednesday. The Nifty Private Bank index was also among the biggest gainers, increasing 0.6%, or 164 points, and standing at 28,722.75. Stocks such as ICICI Bank Ltd, HDFC Bank Ltd, Axis Bank Ltd, and RBL Bank Ltd all rose by up to 1.4% on Wednesday.
On the other hand, the Nifty PSU bank index was the major loser, falling -3.1% or -261.7 points, and standing at 8,253.20. Stocks such as Indian Bank Ltd fell by -5.4%, followed by Punjab National Bank Ltd and Punjab & Sind Bank Ltd, which decreased by up to -3.9% on Wednesday. The Nifty India Defence index was also among the biggest losers, falling -1.8% or -145.45 points, and standing at 7,809.60.
Stocks such as Solar Industries Ltd were down -3.6% on Wednesday. While other stocks like Bharat Dynamics Ltd, Astra Microwave Products Ltd, and Dynamatic Technologies Ltd also decreased by up to -2.5%. The Nifty Capital Markets index was also among the top losers, falling -1.8% or -86.10 points, and standing at 4,660.60.
Asian equity markets closed mixed. Japan’s Nikkei 225 advanced 561.23 points, or 1.14%, to close at 49,864.68, supported by expectations of further U.S. Federal Reserve rate cuts. In contrast, China’s Shanghai Composite fell 19.71 points, or 0.51%, to 3,878.00, while Hong Kong’s Hang Seng Index dropped 334.32 points, or 1.28%, to 25,760.73.
Both markets were weighed down by weaker services-sector data, adding to concerns over China’s ongoing property downturn. South Korea’s KOSPI gained 41.37 points, or 1.04%, closing at 4,036.30, as investor sentiment improved following comments from the Bank of Korea indicating the economy grew at its fastest pace in nearly four years in the third quarter, driven by strong exports.
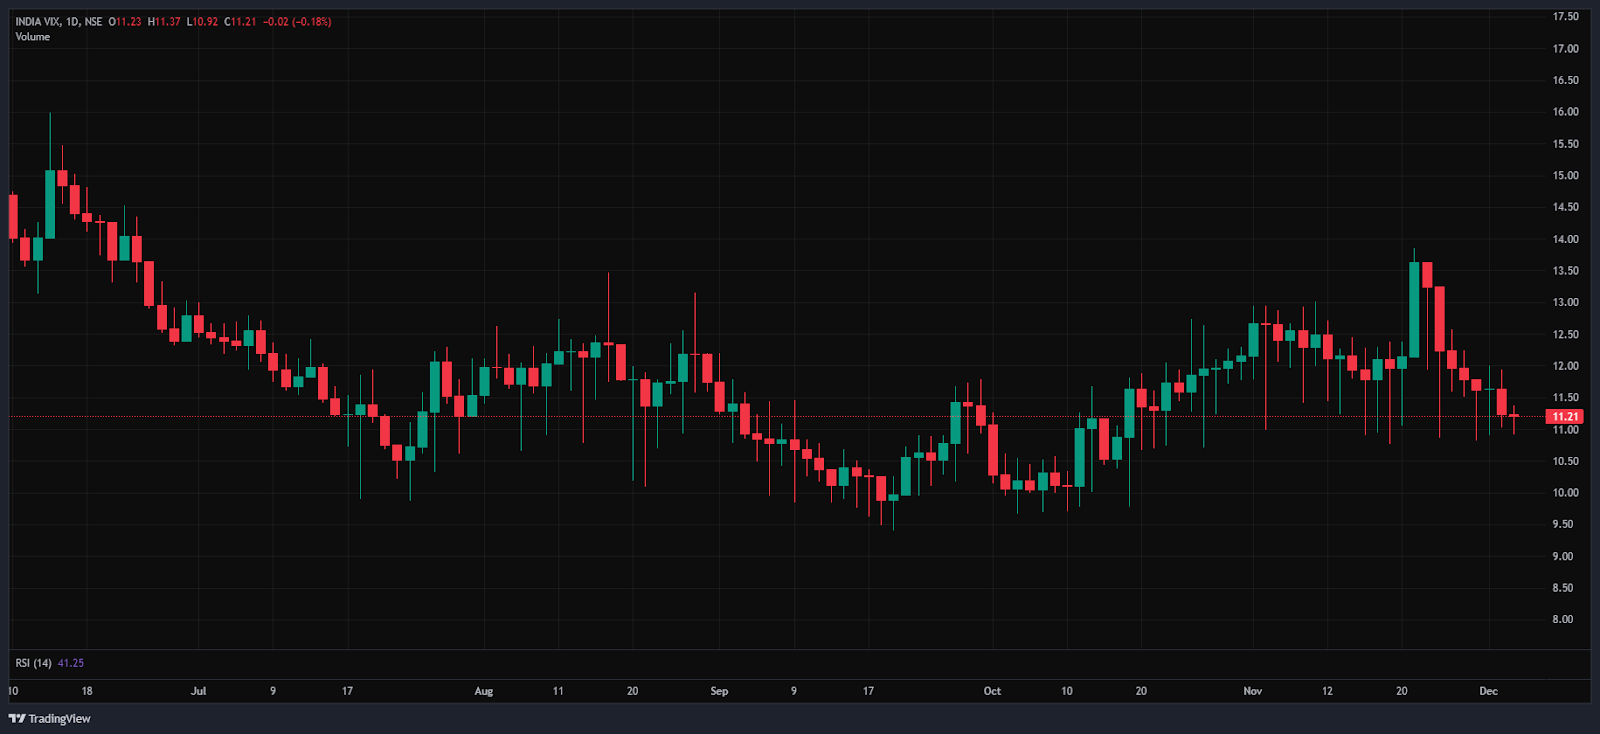
India VIX
The India VIX fell to 11.21, down by 0.02 points (0.18%) during Wednesday’s trading session, indicating stable sentiment in expected market volatility. However, overall volatility remains low, since the India VIX is generally considered elevated only when it rises above 15.
Given the ongoing volatility and mixed sentiments, it’s advisable to avoid aggressive positions and wait for clear directional moves above resistance or below support. Traders should consider these key support and resistance levels when entering long or short positions following the price break from these critical levels. Additionally, traders can combine moving averages to identify more accurate entry and exit points.
DisclaimerThe views and investment tips expressed by investment experts/broking houses/rating agencies on tradebrains.in are their own, and not that of the website or its management. Investing in equities poses a risk of financial losses. Investors must therefore exercise due caution while investing or trading in stocks. Trade Brains Technologies Private Limited or the author are not liable for any losses caused as a result of the decision based on this article. Please consult your investment advisor before investing.
About: Trade Brains Portal is a stock analysis platform. Its trade name is Dailyraven Technologies Private Limited, and its SEBI-registered research analyst registration number is INH000015729.
Investments in securities are subject to market risks. Read all the related documents carefully before investing.
Registration granted by SEBI and certification from NISM in no way guarantee performance of the intermediary or provide any assurance of returns to investors.
The post Technical View: Nifty, Bank Nifty & Sensex Trade Setup and Key levels to watch for 4th December appeared first on Trade Brains.
Related Articles

Why Did Electric Stove Stocks Jump Up to 18% Today?
Synopsis: Electric Stove and appliance stocks surged up to 18 percent as LPG sup...

GE Power: Strong Q4 Results and Robust Order Book Growth; Positive Stock Re-Rating Ahead?
Synopsis: Small-Cap shares hit 5% upper circuit after strong Q4 results and robu...

Rustomjee Developer Keystone Realtors Revenue Surges 172% in Q4 FY26
Synopsis: Keystone Realtors Ltd reported a sharp recovery in Q4 FY26 as the comp...

Bulk Deal: 3 Stocks in Which Promoters and Institutional Investors Bought and Sold Stakes
Synopsis: Several companies witnessed notable bulk deal activity as promoters an...