Technical View: Nifty, Bank Nifty & Sensex Trade Setup and Key levels to watch for 5th December
Alex Smith
6 months ago

The Indian equity markets saw a mixed but mildly positive session on Thursday, as major indices rebounded from a series of recent declines. Despite opening lower amid foreign institutional investor selling and a weakening rupee, the markets managed to close with modest gains, supported by broad-based buying interest. Technical indicators suggest an improving momentum, with key indices holding above important moving averages, signalling cautious optimism among investors.
Sector-wise, technology and defence stocks led the gains, benefiting from renewed investor confidence, while media and consumer durable segments experienced some selling pressure. Meanwhile, Asian markets exhibited a varied performance, with some regional benchmarks rallying on hopes of potential U.S. interest rate cuts, while others closed slightly down, reflecting a cautious global sentiment.
In this overview, we will analyse the key technical levels and trend directions for Nifty and BSE Sensex to monitor in the upcoming trading sessions. All the charts mentioned below are based on the 15-minute timeframe.
NIFTY 50 Chart & Price Action Analysis
To view other technical reports, click here
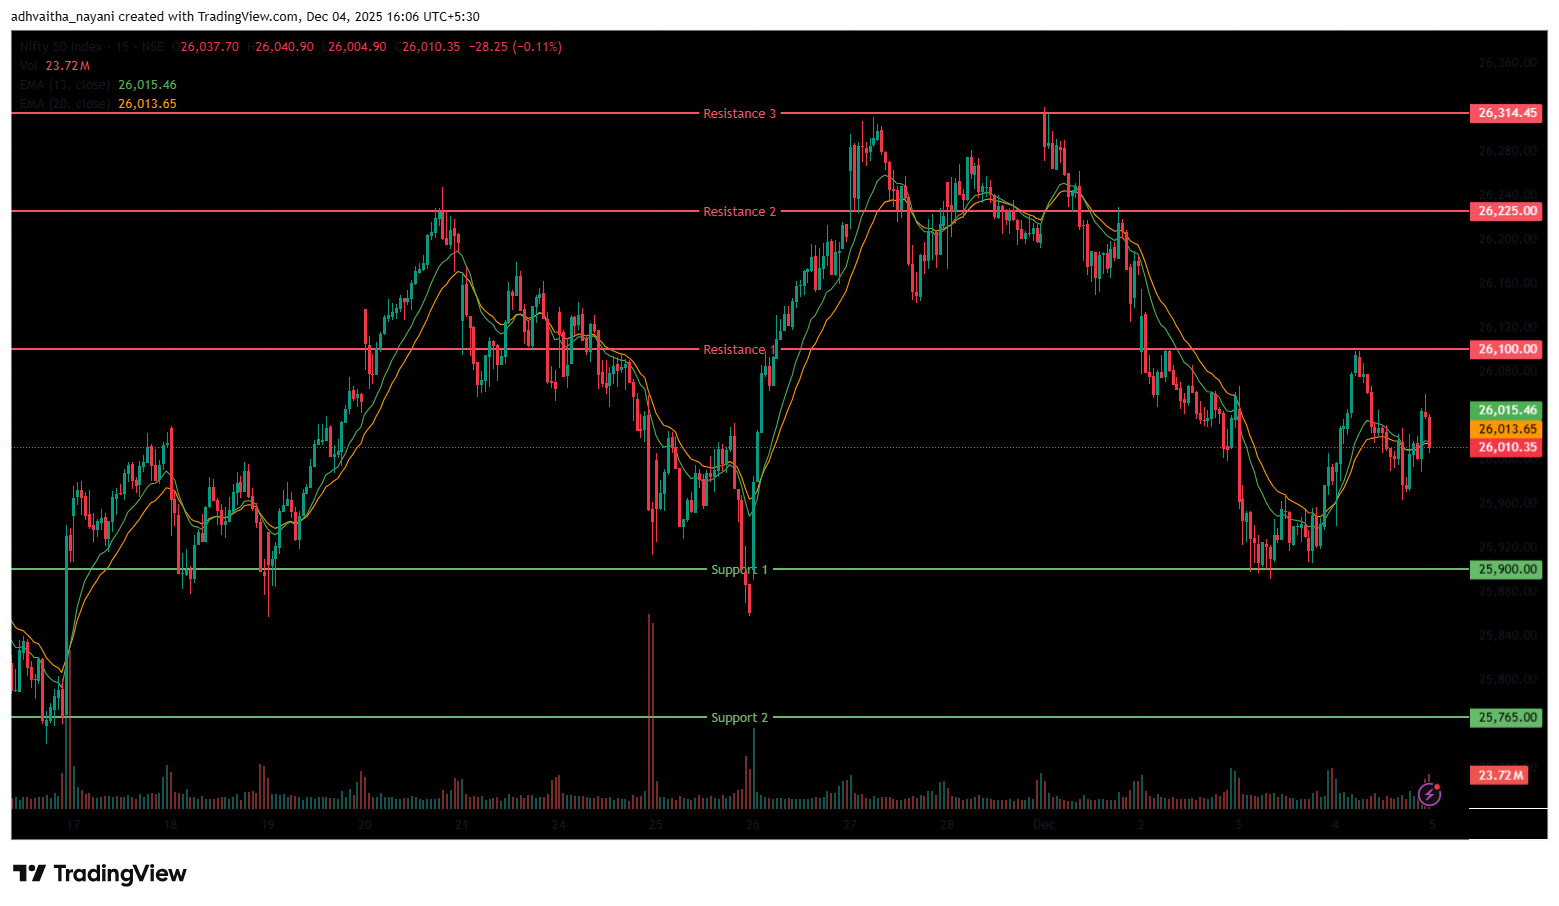
The Nifty 50 Index opened on a flat to negative note at 25,981.85 on Thursday, down by 4.15 points from Wednesday’s closing of 25,986.00. The index started the session on a bearish note and opened above the 25,950 level. The Index rallied and hit its day’s high near the 26,098.25 mark, above the 26,050 level, as well as hitting the day’s low near the 25,938.95 mark in the morning session. It was trading within the range of 25,900 and 26,100.
In the afternoon session, the index lost its momentum, dragged down to the 25,962.40 mark. Later, the Index recovered from the low and was trading above the 26,000 mark. The Index was trading between the range of 25,950 and 26,060. Finally, it had closed on a positive note at 26,033.75, up by 47.75 points, or 0.18%. In the short term, the Index was above the 20-day EMA but fell below the 13-day, indicating a cautious outlook in the daily time frame.
The Nifty 50’s nearest resistance levels are at 26,100 (R1) and 26,225 (R2), the level at which it failed to sustain above, and its next resistance is at 26,314.45 (R3). On the other hand, the closest support is now at 25,900 (S1), and the next one at 25,765 (S2), which were previous resistances now acting as support.
Trade Setup:
Nifty 50Resistance 326,314.45Resistance 226,225.00Resistance 126,100.00Closing Price26,033.75Support 125,900.00Support 225,765.00NIFTY 50 Momentum Indicators Analysis
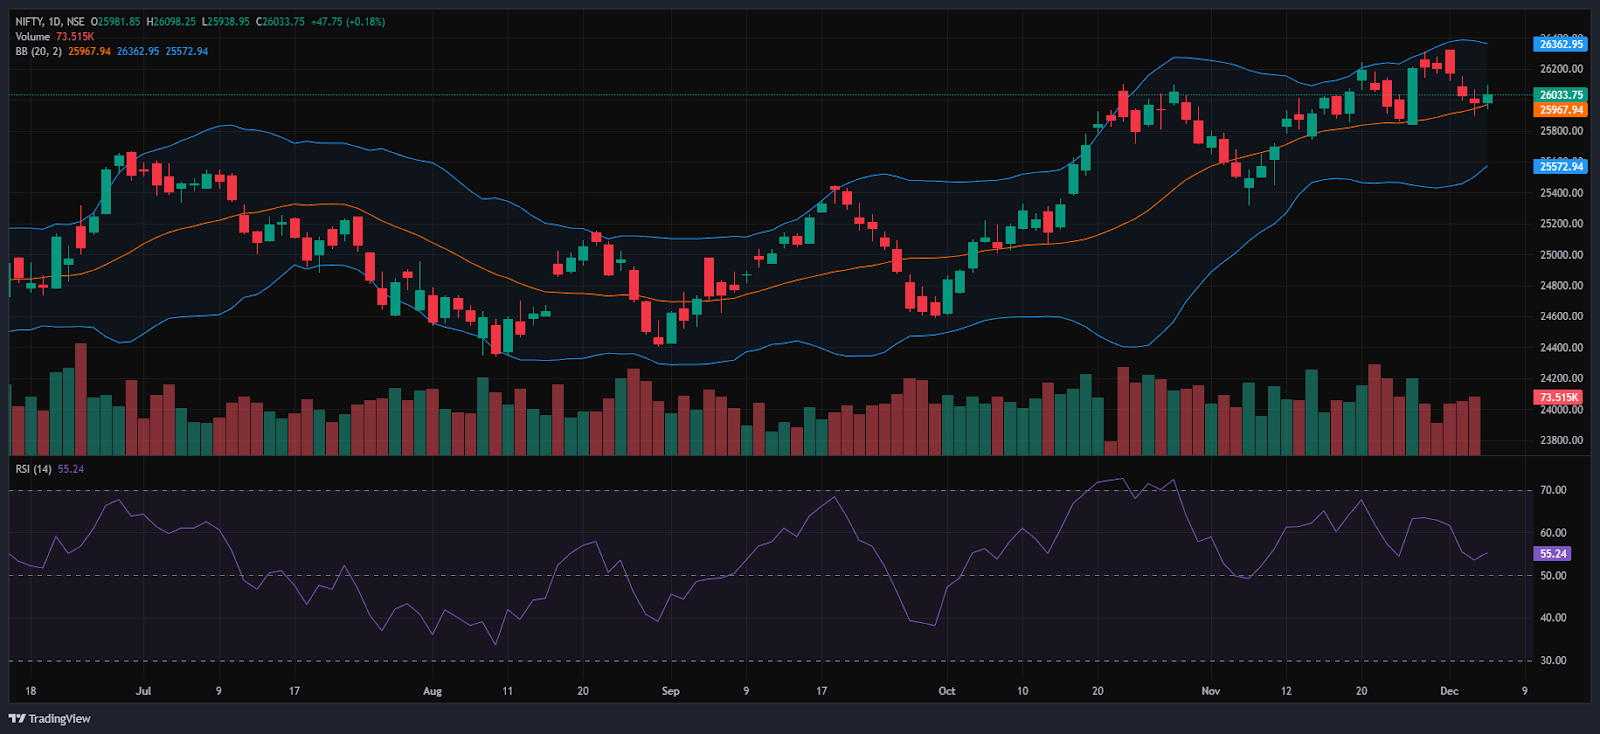
RSI (Daily): The Nifty 50’s RSI stood at 55.24, which is below the overbought zone of 70, indicating room to grow higher.
Bollinger Bands (Daily): The index is trading in the upper band of the Bollinger Band range and nearing the middle band. Its position in the upper range suggests a bullish sentiment in the short term. However, on Thursday’s session, the Index formed a bullish candlestick pattern, with a long wick up and a small wick down, indicating bullish. The index stayed above the 26,000 level on Thursday’s session and was hovering near the 26,050 level. A sustained move above the middle band signals a bullish sentiment, while a drop back toward the lower band may reinforce bearish sentiment.
Volume Analysis: Thursday’s trading session had an average volume of 248.1 Mn.
Derivatives Data: Options open interest (OI) data suggest a strong support zone around 25,900 and 26,000, where put option writing is high, indicating traders expect the index to hold these levels. On the upside, significant call option open interest at 26,100 and 26,200 signals resistance, as sellers are likely to defend these strike prices. The Put/Call Ratio (PCR) stands at 0.8, which is below 1 and indicates a neutral to bullish sentiment with more call activity than put. The presence of a long unwinding indicates that traders are selling their previously bought shares to exit their positions, which is generally considered a bearish signal. This combination implies the market may trade in a range, with strong support near 25,900-26,000 and resistance near 26,100-26,200, until a decisive breakout occurs.
Bank Nifty Chart & Price Action Analysis
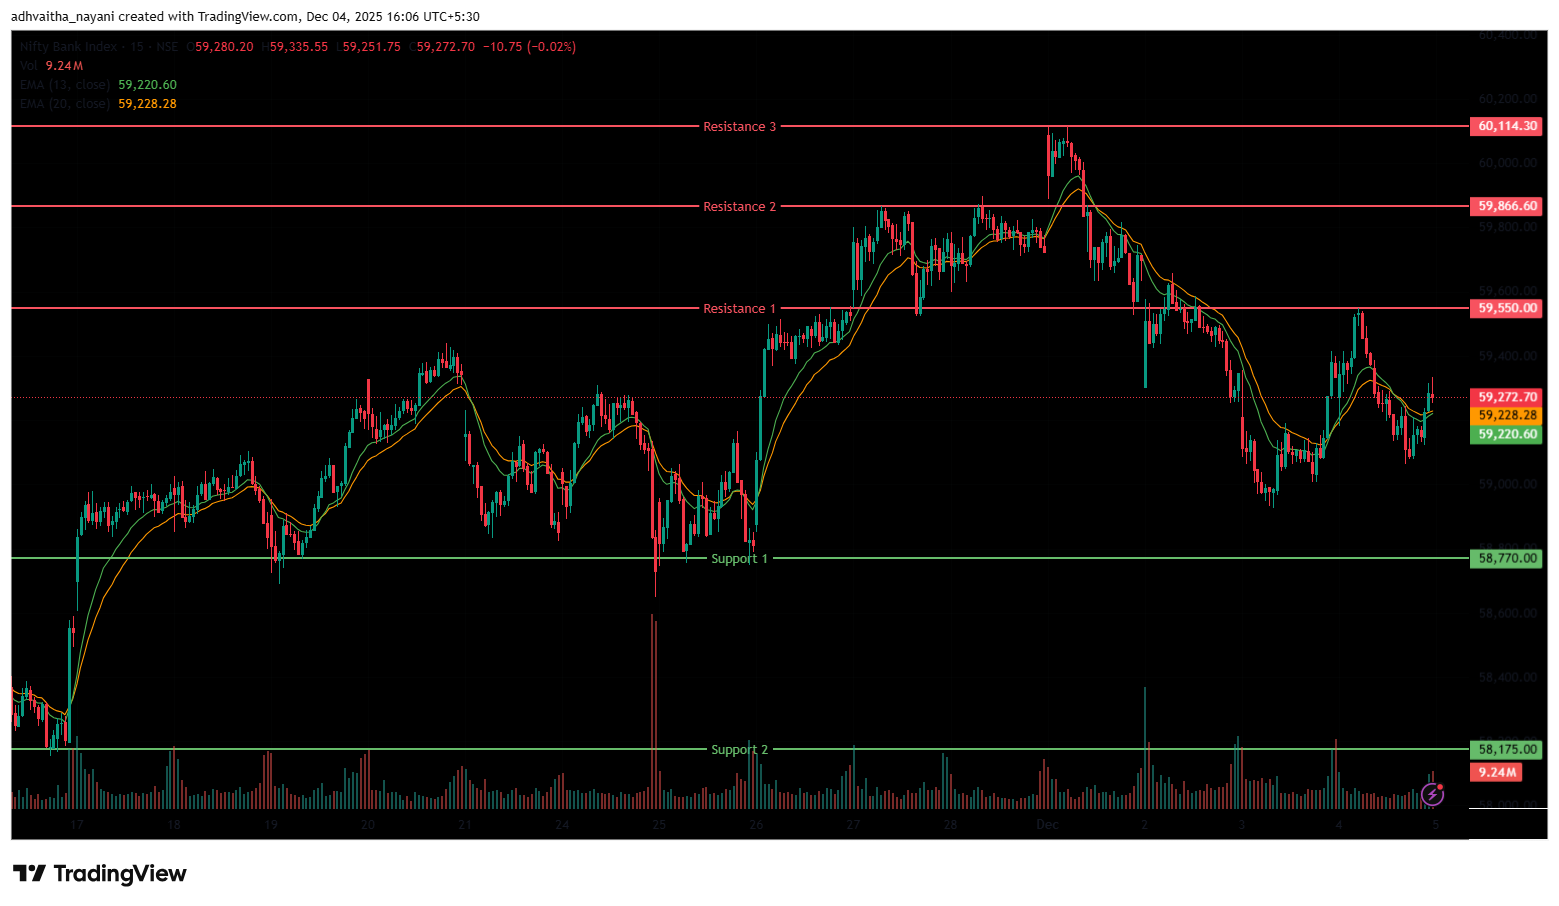
The Bank Nifty Index opened on a negative note at 59,287.10, below the 59,300 level, on Thursday, down by 61.15 points from Wednesday’s closing of 59,348.25. During the morning session, the index initially was trading in an uptrend and hit an intraday high of 59,548.70, though it opened on a negative note. However, the upward momentum did not sustain, and it later started falling to the 59,100 level. It was trading in a range between the 59,200 and 59,500 levels.
In the afternoon session, however, the index recovered slightly from the day’s low (59,062.15) and was trading in the range of 59,100 and 59,300, ending the day below the 59,300 mark. Finally, it had closed in red at 59,288.70, down by 59.55 points or 0.10%. The Relative Strength Index (RSI) stood at 61.35, below the overbought zone of 70 in the daily time frame. In the short term, the Index was above the 13/20 day EMA in the daily time frame, and the Doji candlestick formation suggests momentary indecisiveness.
The nearest resistance is at 59,550.00 (R1) and 59,866.60 (R2). The higher resistance is at 60,114.30 (R3), which is the all-time high for the index. On the other hand, the closest support is now at 58,770 (S1), and the next support is at 58,175 (S2), where the index has taken support at this level previously.
Trade Setup:
Bank NiftyResistance 360,114.30Resistance 259,866.60Resistance 159,550.00Closing Price59,288.70Support 158,770.00Support 258,175.00BSE Sensex Chart & Price Action Analysis
To view other technical reports, click here
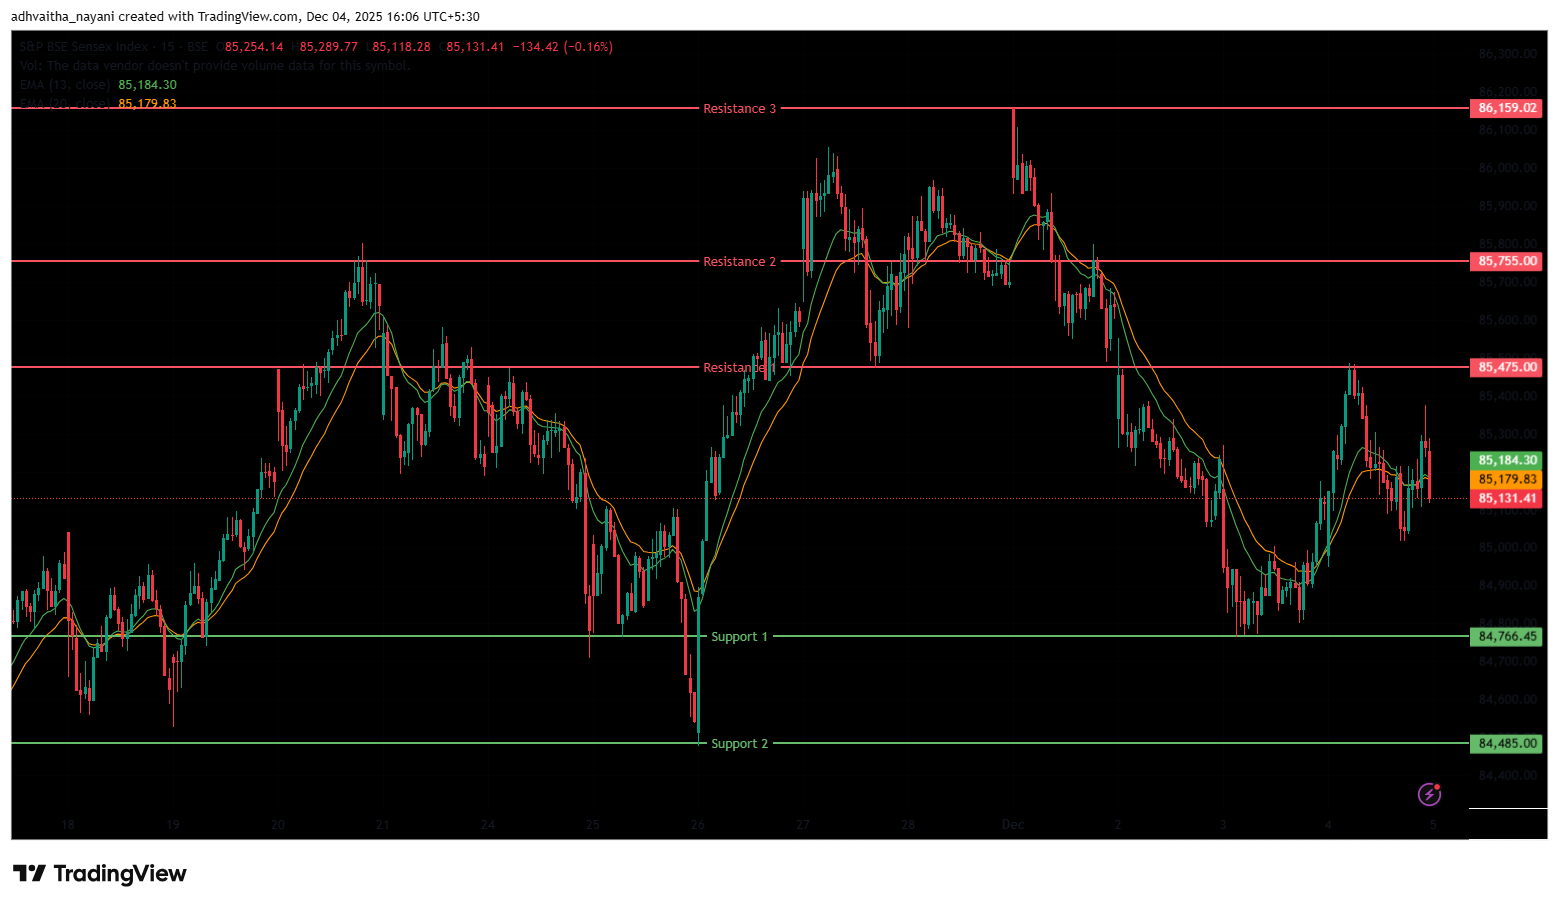
The BSE Sensex Index also opened on a negative note, opening at 84,987.56 on Thursday, down by 119.25 points from Wednesday’s closing of 85,106.81. The Sensex index started the session on a bearish note below the 85,000 mark. During the morning session, the index initially sustained above the 85,000 mark and peaked at 85,487.21. Later on, the index started declining and was trading in the range of 85,100 and 85,350.
In the afternoon session, the index declined to the day’s low of 84,949.98. During the second half, the index recovered slightly from the lows and was trading in the range of 85,050 and 85,250. Finally, it had closed at 85,265.32 on a positive note, up 158.51 points or 0.19%. The Relative Strength Index (RSI) stood at 57.66, below the overbought zone of 70 in the daily time frame. In the short term, the Index was above the 20-day EMA in the daily time frame but was near the 13-day EMA, indicating a cautious outlook.
The index faces immediate resistance at 85,475 (R1) and 85,755 (R2). The higher resistance is at 86,159.02 (R3), a level near its all-time high. On the downside, support lies at 84,766.45 (S1), which was previously resistance and now acts as support; the next one is at 84,485 (S2).
Trade Setup:
SensexResistance 386,159.02Resistance 285,755.00Resistance 185,475.00Closing Price85,265.32Support 184,766.45Support 284,485.00Market Recap on December 4th, 2025
On Thursday, the Nifty 50 opened marginally lower at 25,981.85, down by -4.15 points from its previous close of 25,986. The index hit an intraday low of 25,938.95 and closed slightly above the 26,000 level at 26,033.75, up 47.75 points, or 0.18%. The index closed above all key moving averages (20/50/100/200-day EMAs) on the daily chart. The BSE Sensex followed the same trajectory, opening on a negative trend at 84,987.56, down -119.25 points from the previous close of 85,106.81.
It closed at 85,265.32, up 158.51 points, or 0.19%. Both indices showed moderate momentum, with RSI values for the Nifty 50 at 55.24 and the Sensex at 57.66, below the overbought threshold of 70. The major indices snapped their previous four trading sessions of decline and settled marginally higher on Thursday; however, today’s trading session remained highly volatile amidst the weakening rupee and continued FII selling, marking the fifth straight session of outflows.
On Thursday, major gainers were the Nifty IT index, which rose 1.4% or 535 points and stood at 38,360.25. Stocks such as Coforge Ltd rose 2.8%, followed by Persistent Ltd and LTIMindtree Ltd, which increased by up to 1.9% on Thursday. The Nifty India Defence index was also among the biggest gainers, increasing 0.6%, or 45.65 points, and standing at 7,855.25. Stocks such as Bharat Dynamics Ltd, Unimech Aerospace, Hindustan Aeronautics Ltd, and Mishra Dhatu Nigam Ltd all rose by up to 3% on Thursday.
On the other hand, the Nifty Media bank index was the major loser, falling -1.45% or -21.15 points, and standing at 1,441.4. Stocks such as PVR Inox Ltd fell by -2.86%, followed by Tips Music Ltd and Network 18 Media, which decreased by up to -2.67% on Thursday. The Nifty Consumer Durable index was also among the biggest losers, falling -0.68% or -229.25 points, and standing at 36,701.
Stocks such as Amber Enterprises were down -3.94% on Thursday. While other stocks like Dixon Technologies, Bata India Ltd, and Century Plyboards also decreased by up to -2.22%. The Nifty Small Cap 50 index was also among the top losers, falling -0.34% or -29.35 points, and standing at 8,611.55.
Asian equity markets closed mixed. Japan’s Nikkei 225 advanced 1,006.32 points, or 1.98%, to close at 50,871.00, supported by expectations of further U.S. Federal Reserve rate cuts. In contrast, China’s Shanghai Composite fell -2.21 points, or -0.06%, to 3,875.79, while Hong Kong’s Hang Seng Index rose 133.27 points, or 0.51%, to 25,894.00. South Korea’s KOSPI declined -7.79 points, or -0.19%, closing at 4,028.51.
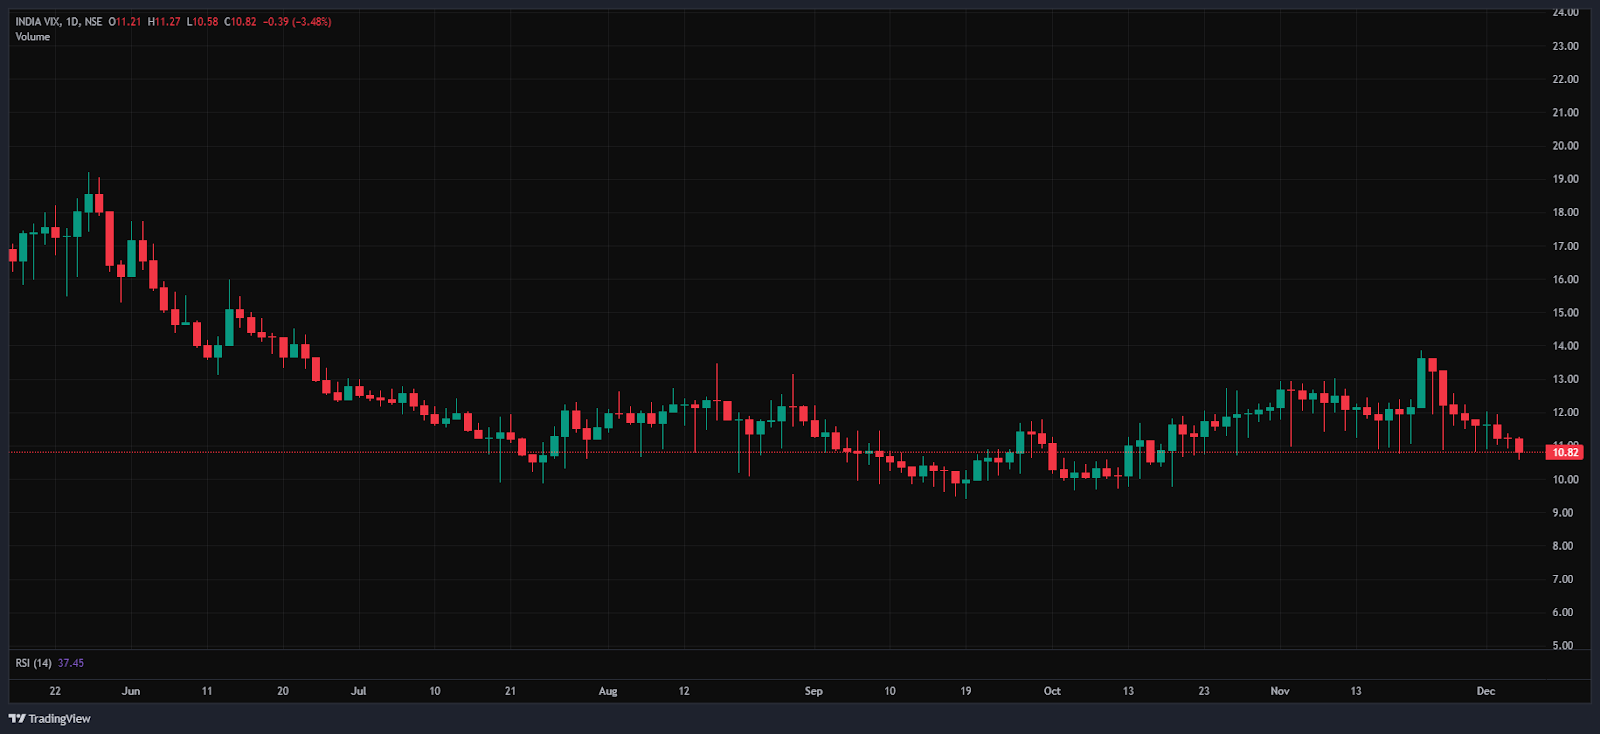
India VIX
The India VIX fell to 10.82, down by 0.39 points (3.48%) during Thursday’s trading session, indicating stable sentiment in expected market volatility in the daily time frame. However, overall volatility remains low, since the India VIX is generally considered elevated only when it rises above 15.
Given the ongoing volatility and mixed sentiments, it’s advisable to avoid aggressive positions and wait for clear directional moves above resistance or below support. Traders should consider these key support and resistance levels when entering long or short positions following the price break from these critical levels. Additionally, traders can combine moving averages to identify more accurate entry and exit points.
DisclaimerThe views and investment tips expressed by investment experts/broking houses/rating agencies on tradebrains.in are their own, and not that of the website or its management. Investing in equities poses a risk of financial losses. Investors must therefore exercise due caution while investing or trading in stocks. Trade Brains Technologies Private Limited or the author are not liable for any losses caused as a result of the decision based on this article. Please consult your investment advisor before investing.
About: Trade Brains Portal is a stock analysis platform. Its trade name is Dailyraven Technologies Private Limited, and its SEBI-registered research analyst registration number is INH000015729.
Investments in securities are subject to market risks. Read all the related documents carefully before investing.
Registration granted by SEBI and certification from NISM in no way guarantee performance of the intermediary or provide any assurance of returns to investors.
The post Technical View: Nifty, Bank Nifty & Sensex Trade Setup and Key levels to watch for 5th December appeared first on Trade Brains.
Related Articles

5 Stocks Recommended by Top Brokerages That Can Deliver Returns of Up to 45%
Synopsis: Five top brokerages have issued fresh Buy calls across IT, FMCG, trave...

₹3,200 Cr Order Book: Can This Smart Meter Stock Evolve Into an Electrical Solutions Co.?
Synopsis: HPL Electric delivered a record FY26, backed by strong smart meter dem...

Tata Motors: Can It Double Passenger Vehicle Volumes and Reach 20% Market Share by FY31?
Synopsis: Tata Motors targets strong PV growth with EV-led expansion, aiming to...

KPIT Technologies: Will Q1 Results Be Strong Enough For A Turnaround?
Synopsis: KPIT Technologies has spent the past year explaining why growth slowed...