The $33 Billion Inundation: Ethereum Inflows Hit a 15-Month High As Price Teeters At $1,955
Alex Smith
4 months ago

Ethereum is struggling to hold above the $2,000 level as the broader crypto market enters a more fragile phase marked by persistent selling pressure, fading momentum, and elevated uncertainty. Despite several rebound attempts in recent weeks, price action has remained subdued, with liquidity conditions tightening and investor sentiment turning increasingly cautious. The inability to secure sustained acceptance above this psychological threshold has reinforced the perception that the market is still navigating a corrective environment rather than transitioning into a clear recovery phase.
A recent CryptoQuant report provides additional context by highlighting a sharp increase in exchange activity. According to the data, total Ethereum inflows to Binance over the past 30 days reached roughly $33.3 billion — the highest level recorded since last November. This surge comes as ETH trades near $1,955 after a gradual but persistent decline in recent weeks.
Historically, rising inflows to major exchanges tend to indicate a growing supply of assets available for trading. When substantial volumes of Ethereum move onto platforms like Binance, they may be used for spot sales, derivatives collateral, or portfolio rebalancing. Consequently, this spike in inflows signals heightened market activity and potentially increased short-term volatility.
Exchange Inflows Surge As Market Tests Supply Absorption
While the recent surge in Ethereum inflows to Binance may initially appear bearish, the report emphasizes that this development should not automatically be interpreted as a negative signal. Elevated exchange inflows can sometimes reflect strategic repositioning rather than immediate selling intent. Investors may be preparing to actively trade, hedge exposure, or adjust portfolio allocations, particularly during periods of heightened volatility when liquidity access becomes more critical.
In addition, strong inflow phases have occasionally preceded periods of price stabilization. When additional supply entering exchanges is met by sufficient demand, markets can transition into consolidation rather than extended declines. This dynamic often depends on broader liquidity conditions, derivatives positioning, and macro sentiment rather than inflows alone.
That said, registering the highest inflow level since last November places Ethereum in a structurally sensitive phase. The market’s reaction to these flows will likely provide clearer directional signals in the coming weeks. If the added supply translates into persistent sell-side pressure, downside risks could remain elevated. Conversely, if demand absorbs this liquidity effectively, the current phase may represent redistribution ahead of a more constructive move rather than sustained weakness.
Ethereum Price Holds Fragile Ground Below Key Resistance
Ethereum’s weekly chart reflects a structurally fragile environment as price continues trading below the $2,000 psychological threshold. After failing to sustain momentum above the mid-2025 highs near the $4,800 region, ETH has established a sequence of lower highs and lower lows — a classic downtrend formation indicating persistent distribution rather than consolidation.
Technically, Ethereum is now positioned beneath its key moving averages, which previously acted as dynamic support during the rally phase. These averages have rolled over and now function as resistance zones, limiting recovery attempts unless decisively reclaimed. The recent rejection near the $3,000 area reinforced this bearish transition, accelerating downside momentum toward the current ~$1,900 region.
Volume trends show declining participation compared with the expansion phase, suggesting reduced speculative enthusiasm. However, declining volume during corrections can sometimes precede stabilization if selling pressure becomes exhausted.
From a structural perspective, immediate support appears near the $1,800–$1,900 range, where prior consolidation occurred. A sustained break below this zone could expose deeper retracement levels toward historical accumulation areas. Conversely, reclaiming the $2,200–$2,400 region with strong volume would be required to shift short-term momentum back toward a neutral or constructive bias.
Featured image from ChatGPT, chart from TradingView.com
Related Articles
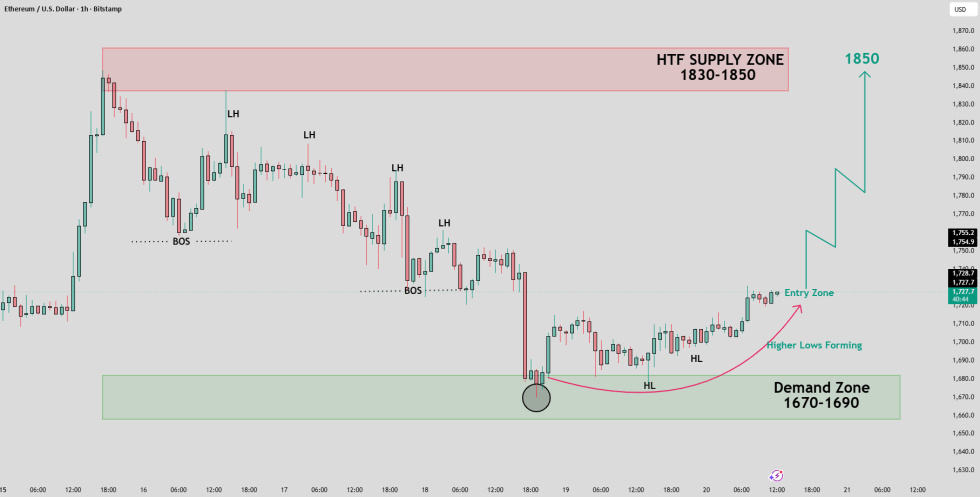
Ethereum Price Setup Targets $1,850 As Buyers Defend Key Demand Zone
A TradingView analyst says Ethereum could target $1,850 if buyers defend the $1,...
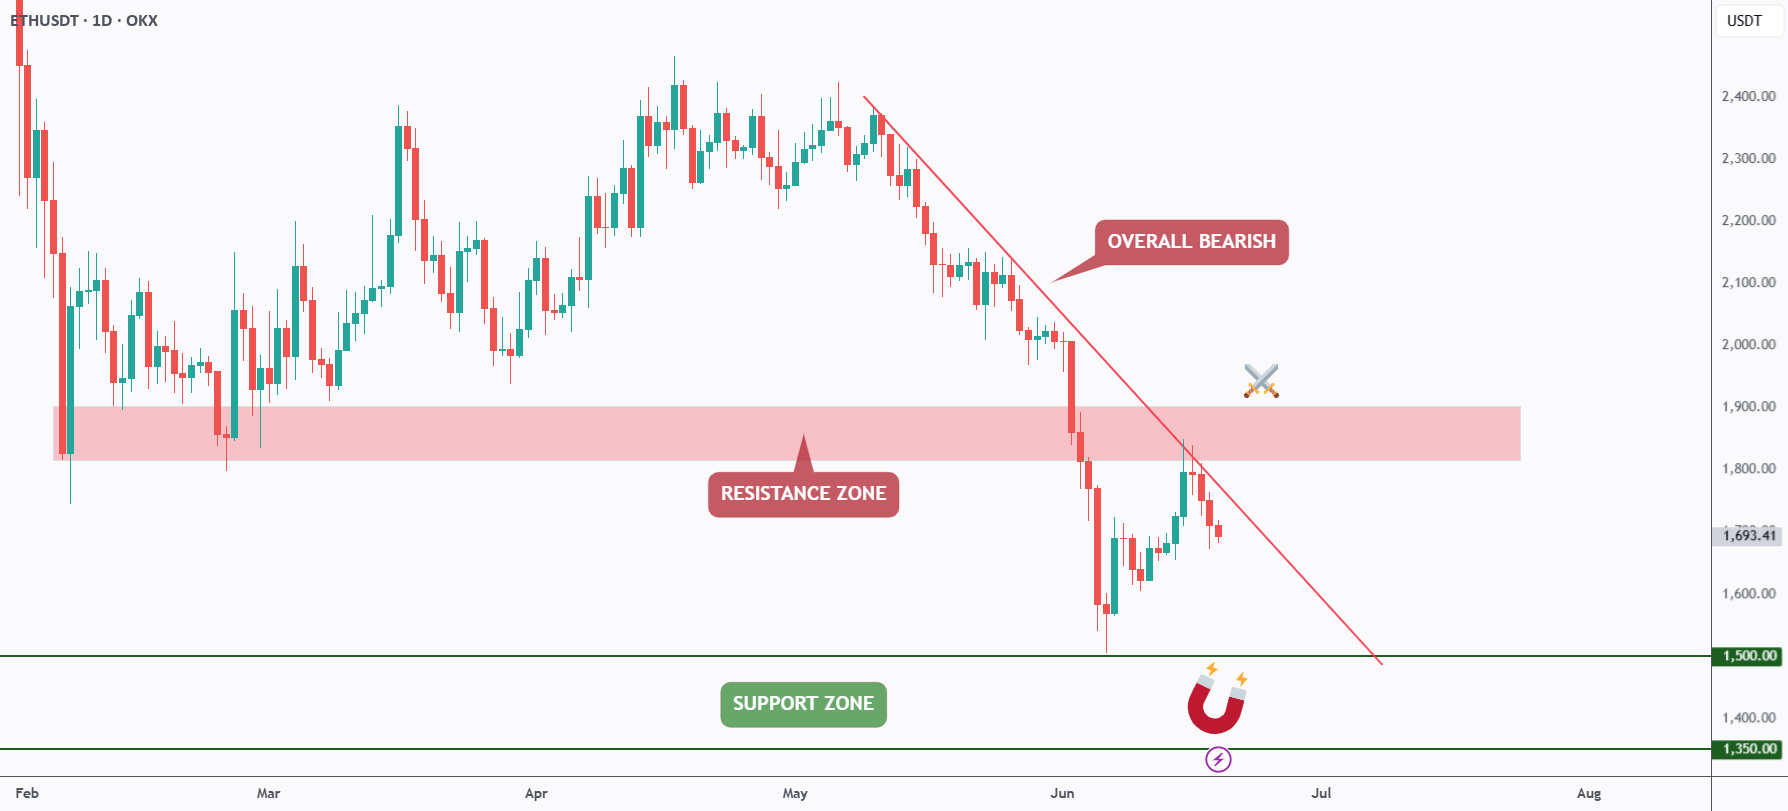
Ethereum Bears Keep Control As ETH Rejects Trendline Resistance
A TradingView analyst says Ethereum remains bearish below a falling trendline, w...
ETH/BTC Ratio Falls Back To Early-2023 Levels As Traders Debate Ethereum Value
An X analyst says ETH/BTC is back near 0.027, while a TradingView chart shows ET...
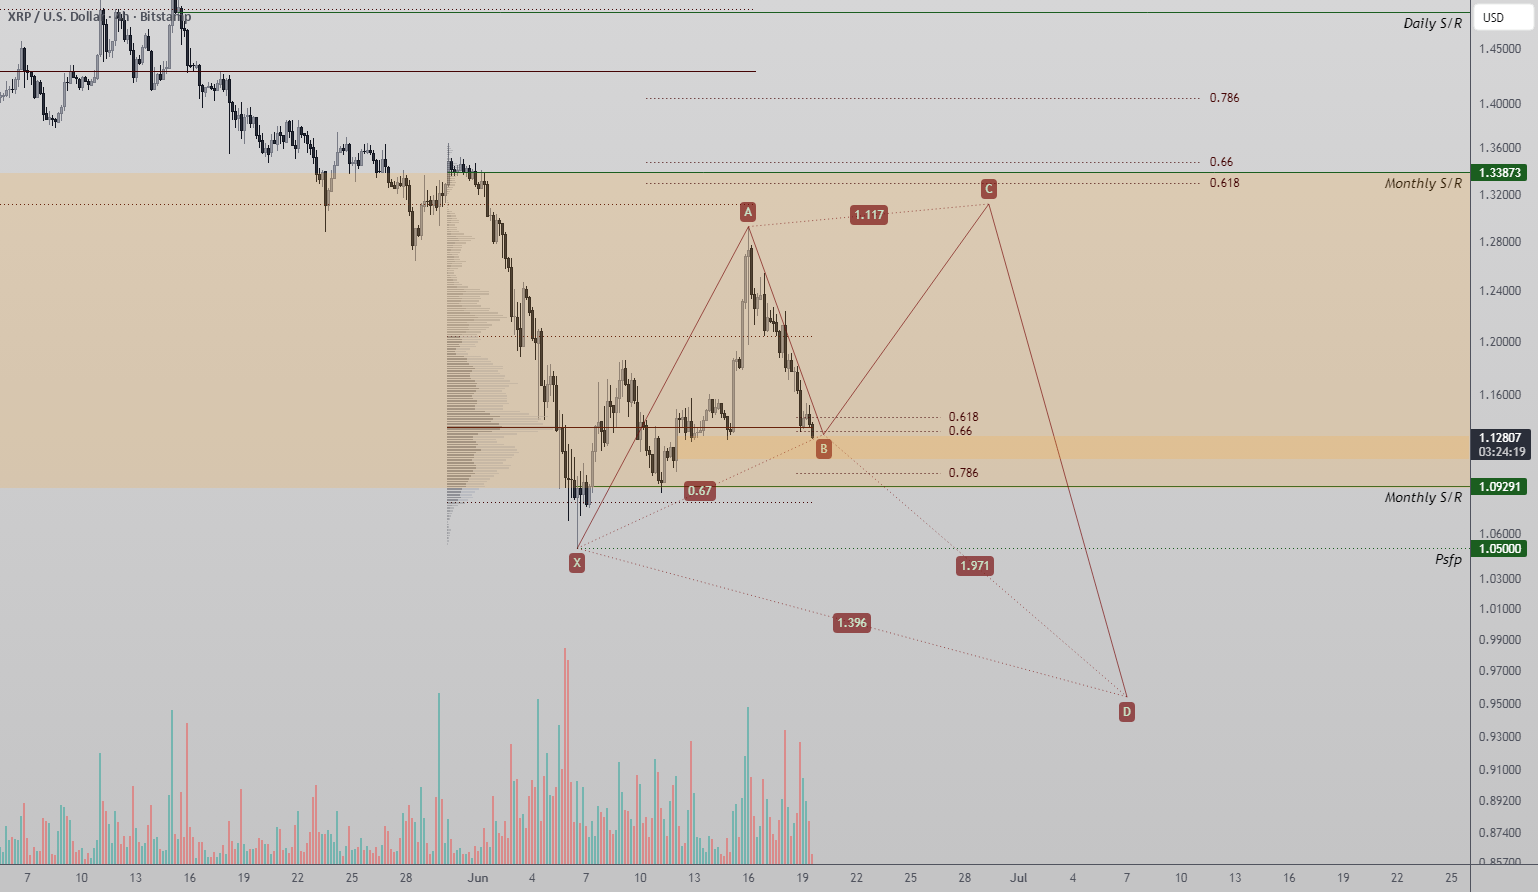
XRP Reversal Setup Forms Around Harmonic Pattern And Key Support Zone
A TradingView analyst says XRP is testing a technically important support zone s...