Why The 2025 Close Below $100,000 Is Terrible For The Bitcoin Price
Alex Smith
5 months ago

The Bitcoin price went through the final days of 2025 attempting to push above $90,000 after weeks of downside price action, but it ultimately failed to defend this level into the yearly close. At the time of writing, Bitcoin is trading at $88,750, meaning it closed the year 2025 below $100,000.
This price action has added pressure to sentiment, and higher-timeframe indicators are pointing to growing exhaustion. According to a 3-month candlestick analysis shared on X by analyst Greeny, the way Bitcoin closed 2025 may carry deeper implications than most traders currently understand.
3-Month Bearish Engulfing Points To Weakness
Technical analysis of Bitcoin’s price action on the 3-month candlestick timeframe shows the cryptocurrency just printed a large bearish engulfing candle that fully overtook the prior quarterly advance. This type of candle is rare on such a high timeframe and typically points to a decisive shift in control from buyers to sellers.
The chart shared by Greeny shows that this engulfing structure formed after Bitcoin failed to hold above its 2025 highs above $120,000 in October, and this shows that the year ended in distribution.
Interestingly, $106,700 is now an important level moving forward because it corresponds with the bottom of the previous 3-month candle. With Bitcoin now trading below that zone, it flips from support into a heavy resistance area for price action in Q1. Any recovery attempt in early 2026 would need to reclaim this level convincingly to avoid further rejection.
Furthermore, the stochastic level near $108,000 is another important level to look at for Bitcoin’s price action in Q1 2026. According to Greeny, if the Bitcoin price closes below this zone after the first quarter, it would indicate continued downside pressure. Together, these levels form a tight ceiling overhead, meaning even strong relief rallies could struggle to transition into sustainable uptrends as we move into the new year.
Bitcoin 3-month Candlestick Price Chart: @greenytrades on X
Stochastic Exhaustion Points To A Possible Cycle Peak
Another concerning element of Greeny’s analysis centers on the stochastic indicator. According to the analyst, this is the first time in Bitcoin’s history that the stochastic has reached the 80th percentile on the 3-month timeframe. This is otherwise notable because this is a zone generally associated with exhaustion and a local or bull cycle top.
The chart also shows the red moving average crossing above the blue while sitting well below the stochastic band, a configuration Greeny interprets as confirmation of a local top. This setup is likely pointing to the end of the current bull cycle and will only be invalidated if Bitcoin manages to close above $108,000 by the end of March.
Liquidity conditions across the entire crypto market tightened through late 2025 as the Central Bank of Japan maintained higher interest rates. This has led to Bitcoin underperforming compared to other notable assets, while precious metals such as gold and silver pushed to new price highs.
Related Articles
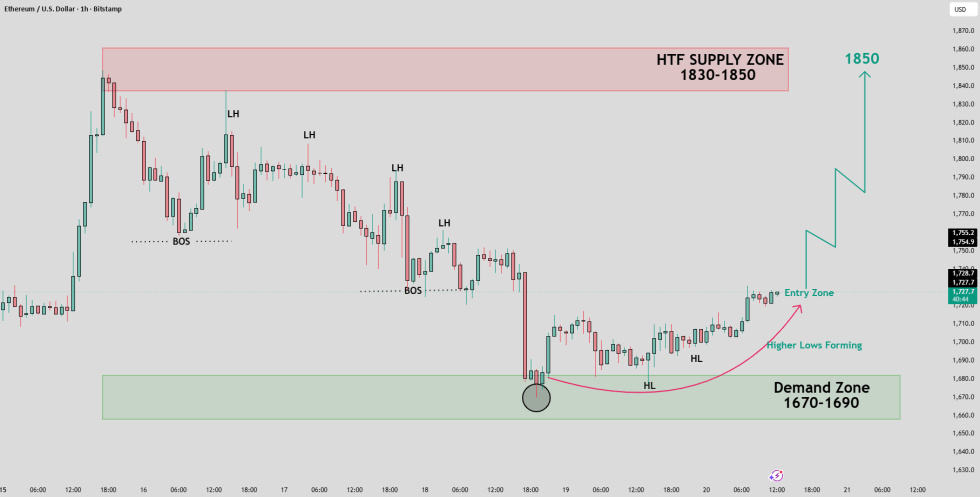
Ethereum Price Setup Targets $1,850 As Buyers Defend Key Demand Zone
A TradingView analyst says Ethereum could target $1,850 if buyers defend the $1,...
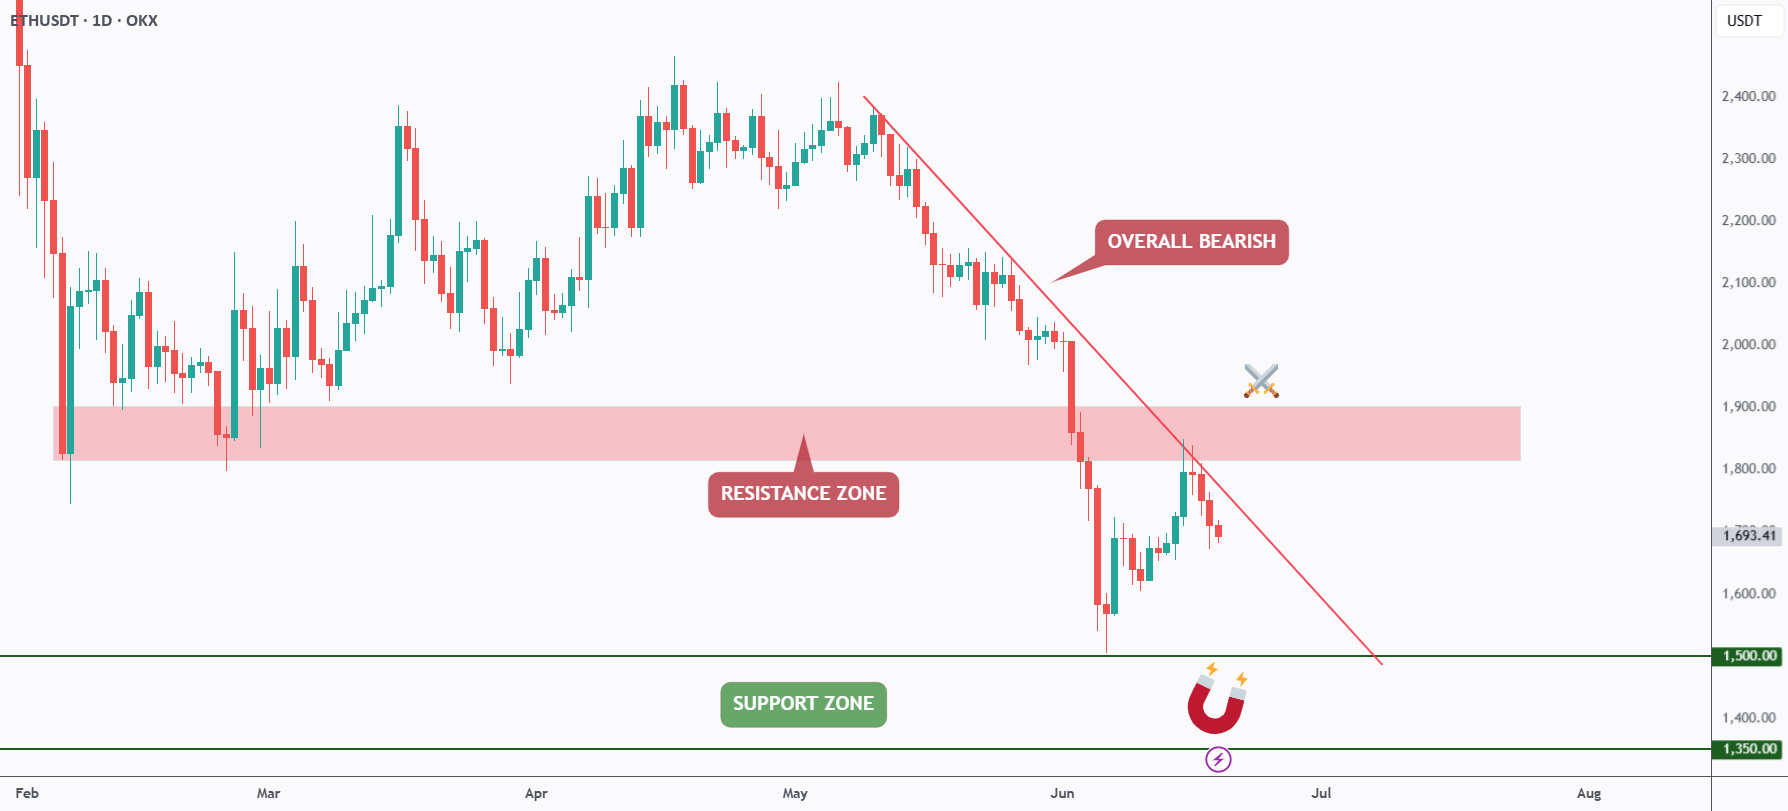
Ethereum Bears Keep Control As ETH Rejects Trendline Resistance
A TradingView analyst says Ethereum remains bearish below a falling trendline, w...
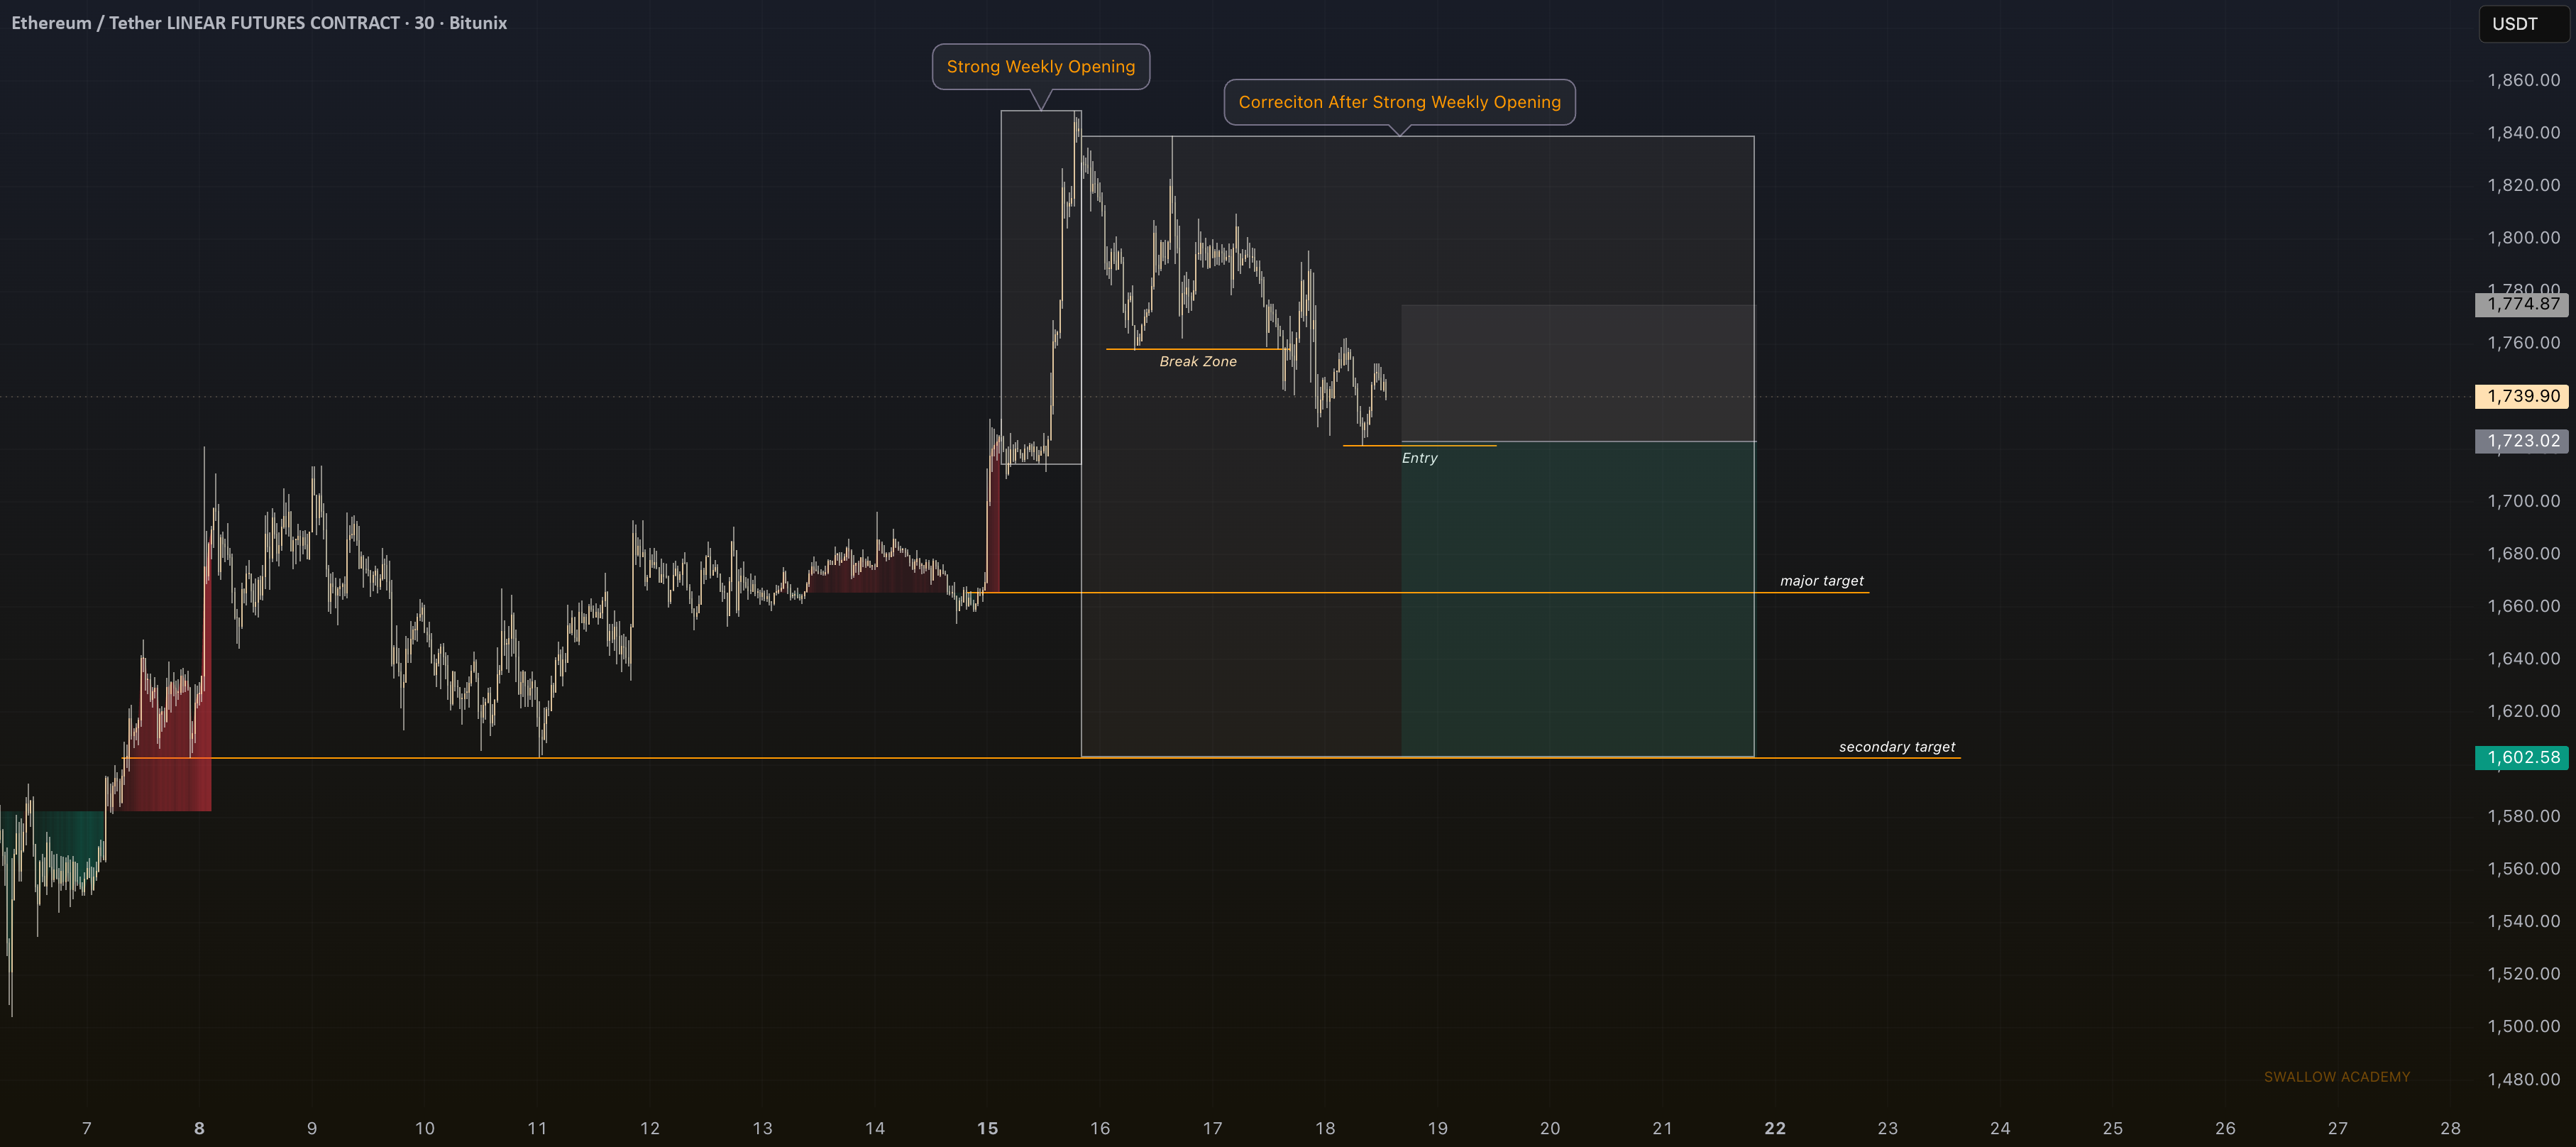
ETH/BTC Ratio Falls Back To Early-2023 Levels As Traders Debate Ethereum Value
An X analyst says ETH/BTC is back near 0.027, while a TradingView chart shows ET...
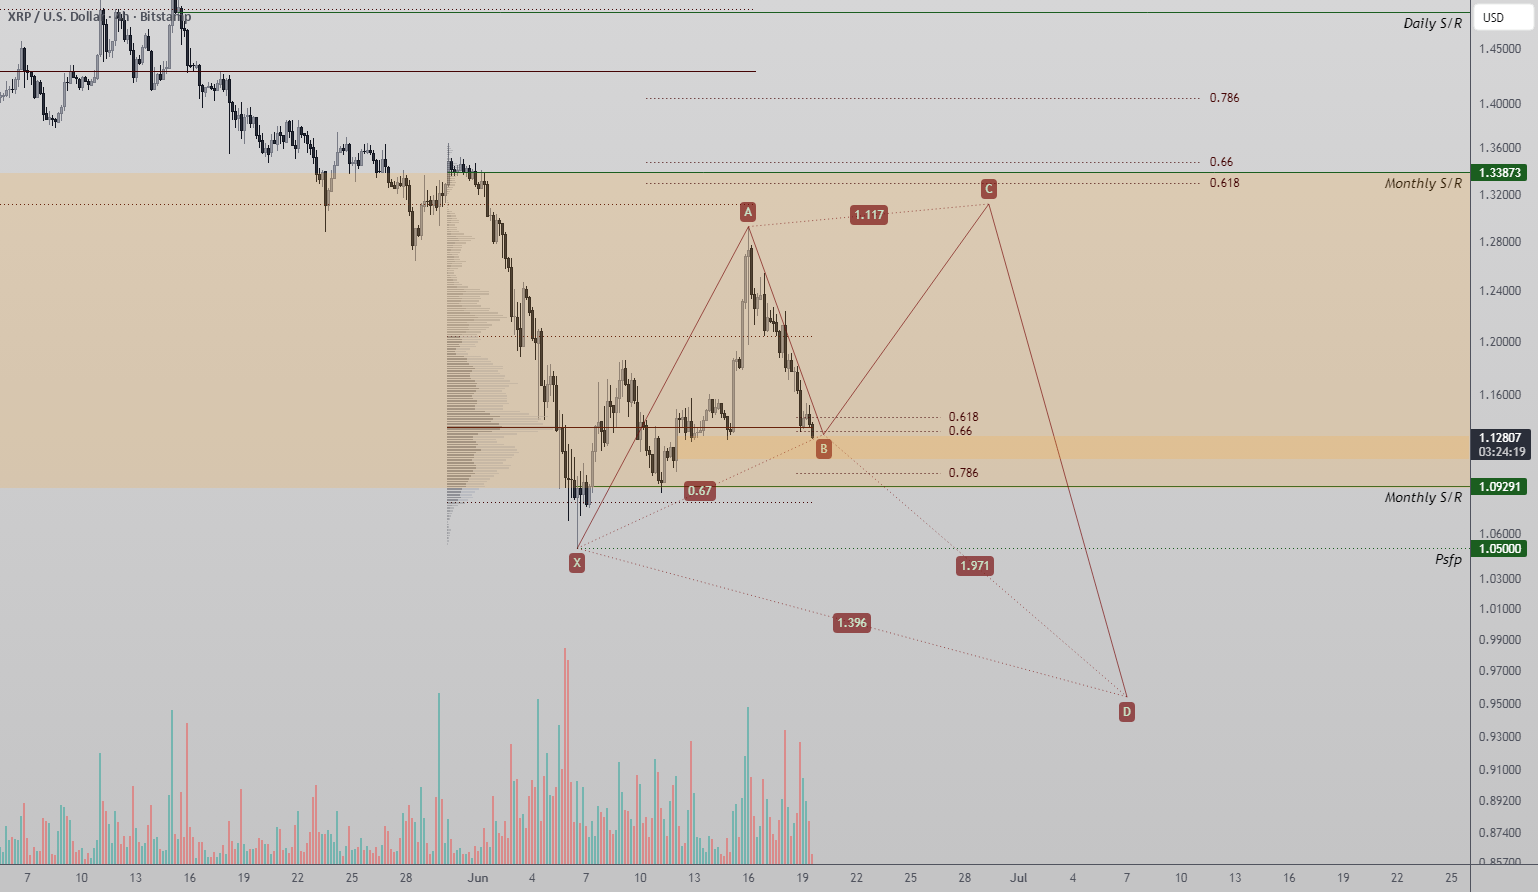
XRP Reversal Setup Forms Around Harmonic Pattern And Key Support Zone
A TradingView analyst says XRP is testing a technically important support zone s...