XRP Analyst Says Filter Out The Noise And Look At This Instead
Alex Smith
3 months ago

Recent movements in XRP have left some traders underwhelmed, particularly as many remain focused on its day-to-day price swings. However, one market analyst suggests that these short-term fluctuations can be misleading. By stepping back and examining the monthly chart instead, the analyst argues that a clearer and more bullish market structure begins to emerge.
Short-Term XRP “Noise
Recently, crypto analyst @Jaydee_757 took to X to highlight what he sees as a common mistake in how traders interpret XRP price movements. His argument centers on the tendency to judge the asset’s direction using short-term activity instead of the broader market trend.
Over the past day, XRP has traded gradually around the $1.30 range, posting modest gains and relatively small intraday swings. For traders focused on hourly or daily charts, this kind of movement can appear slow or uneventful. However, Jaydee argues that such price action represents only a small portion of the market’s overall structure.
According to him, this is where what traders call “noise” begins to dominate perception. When market participants closely track every minor fluctuation, those movements can draw disproportionate attention and trigger emotional reactions.
This effect becomes more noticeable during consolidation phases, when prices move sideways rather than trending strongly upward. Short-term traders may interpret these pauses as weakness or fading momentum, even though consolidation often forms before larger moves.
Jaydee notes that stepping back to a higher timeframe helps remove much of this distraction, allowing traders to focus on the underlying trend rather than the day-to-day volatility.
Monthly Chart Highlights Breakout And Possible Retest
To illustrate this broader perspective, the analyst shared a chart of XRP’s market structure on the monthly timeframe. The chart highlights a large ascending triangle pattern that has formed over an extended period, with a horizontal resistance level at the top and a rising trendline connecting higher lows beneath it.
Within the chart, XRP is shown breaking above that resistance line in a strong upward move. This breakout is marked clearly before the price pulls back toward the same level it previously surpassed. The analyst interprets this pullback as a potential retest of the former resistance, a common technical development that can confirm the level as new support.
If this retest holds, the chart outlines a possible continuation of the upward trend. The projected move points toward a higher target zone represented by a green box, indicating where XRP could advance if bullish momentum resumes.
Another highlighted region, labeled as a pink box, remains part of the broader setup and could still play a role during the current consolidation phase. While short-term price movements may continue within this range, the analyst’s macro outlook remains focused on the larger triangle breakout.
From that perspective, the current price action may simply reflect a transitional period rather than a breakdown in momentum. By concentrating on the long-term structure instead of day-to-day fluctuations, the analyst maintains that XRP’s broader trajectory remains firmly in view.
Related Articles
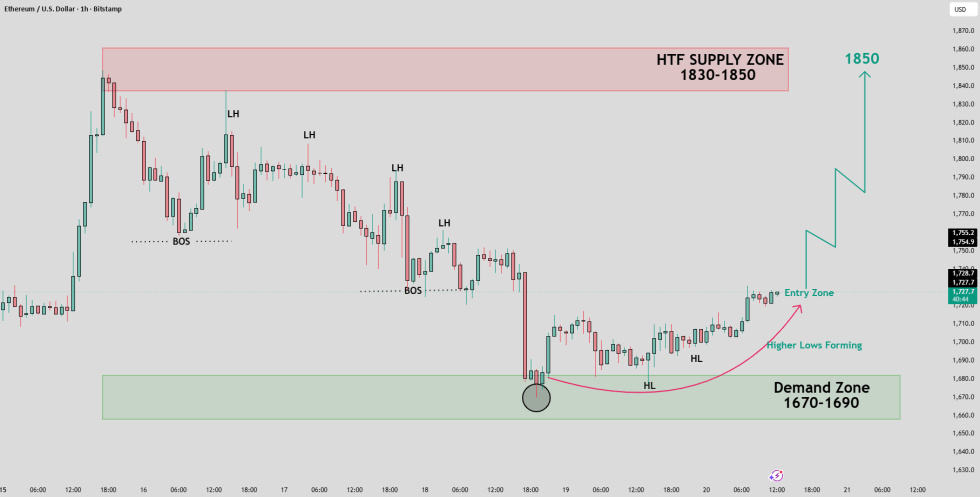
Ethereum Price Setup Targets $1,850 As Buyers Defend Key Demand Zone
A TradingView analyst says Ethereum could target $1,850 if buyers defend the $1,...
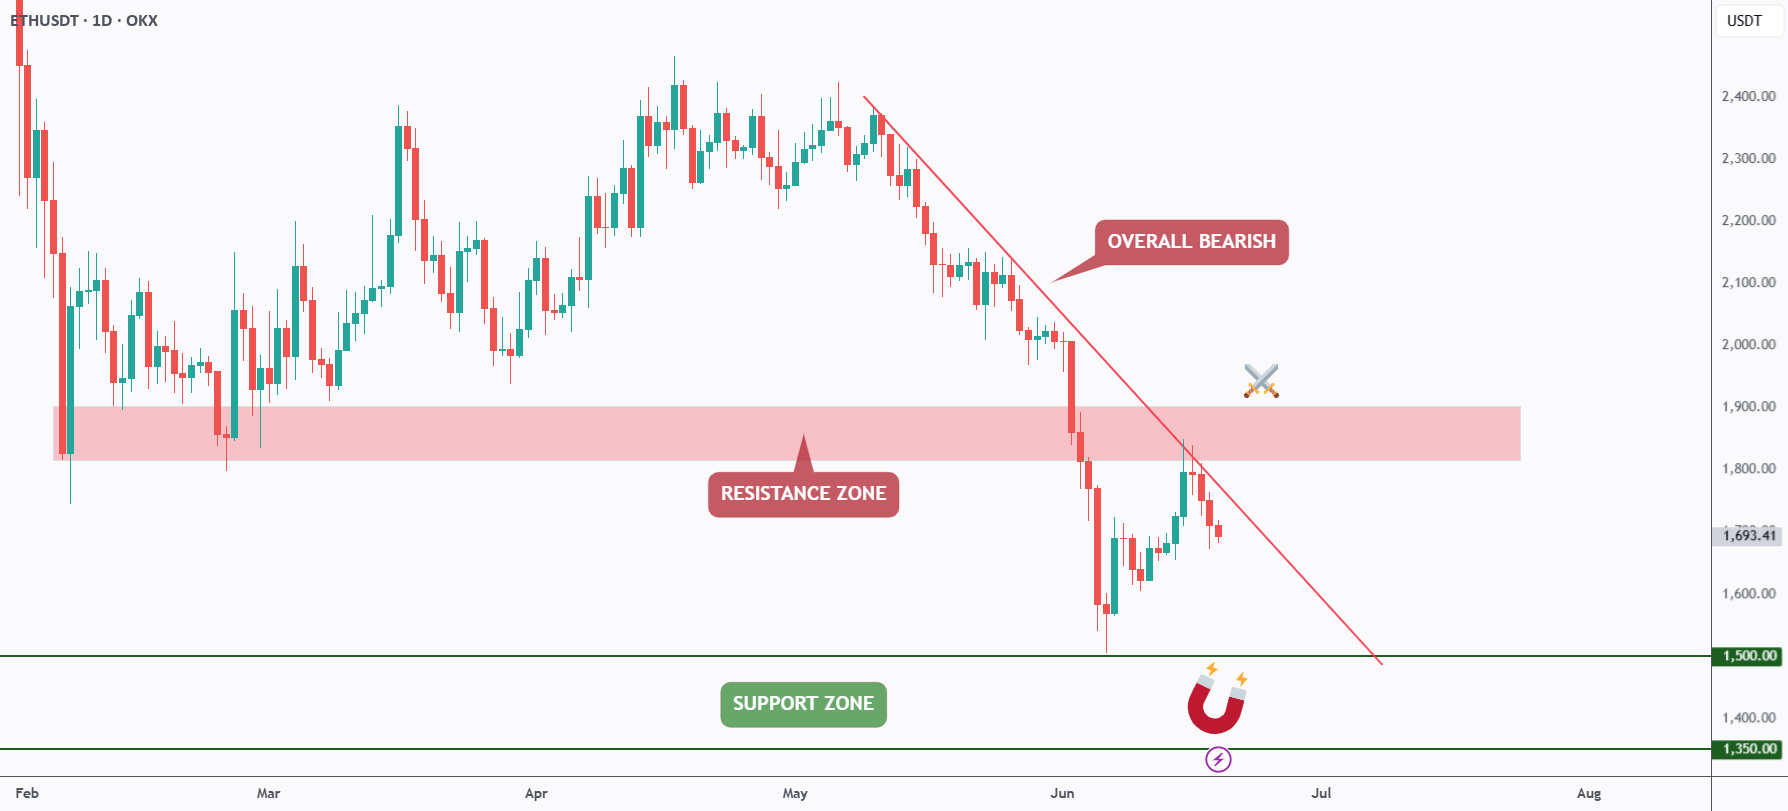
Ethereum Bears Keep Control As ETH Rejects Trendline Resistance
A TradingView analyst says Ethereum remains bearish below a falling trendline, w...
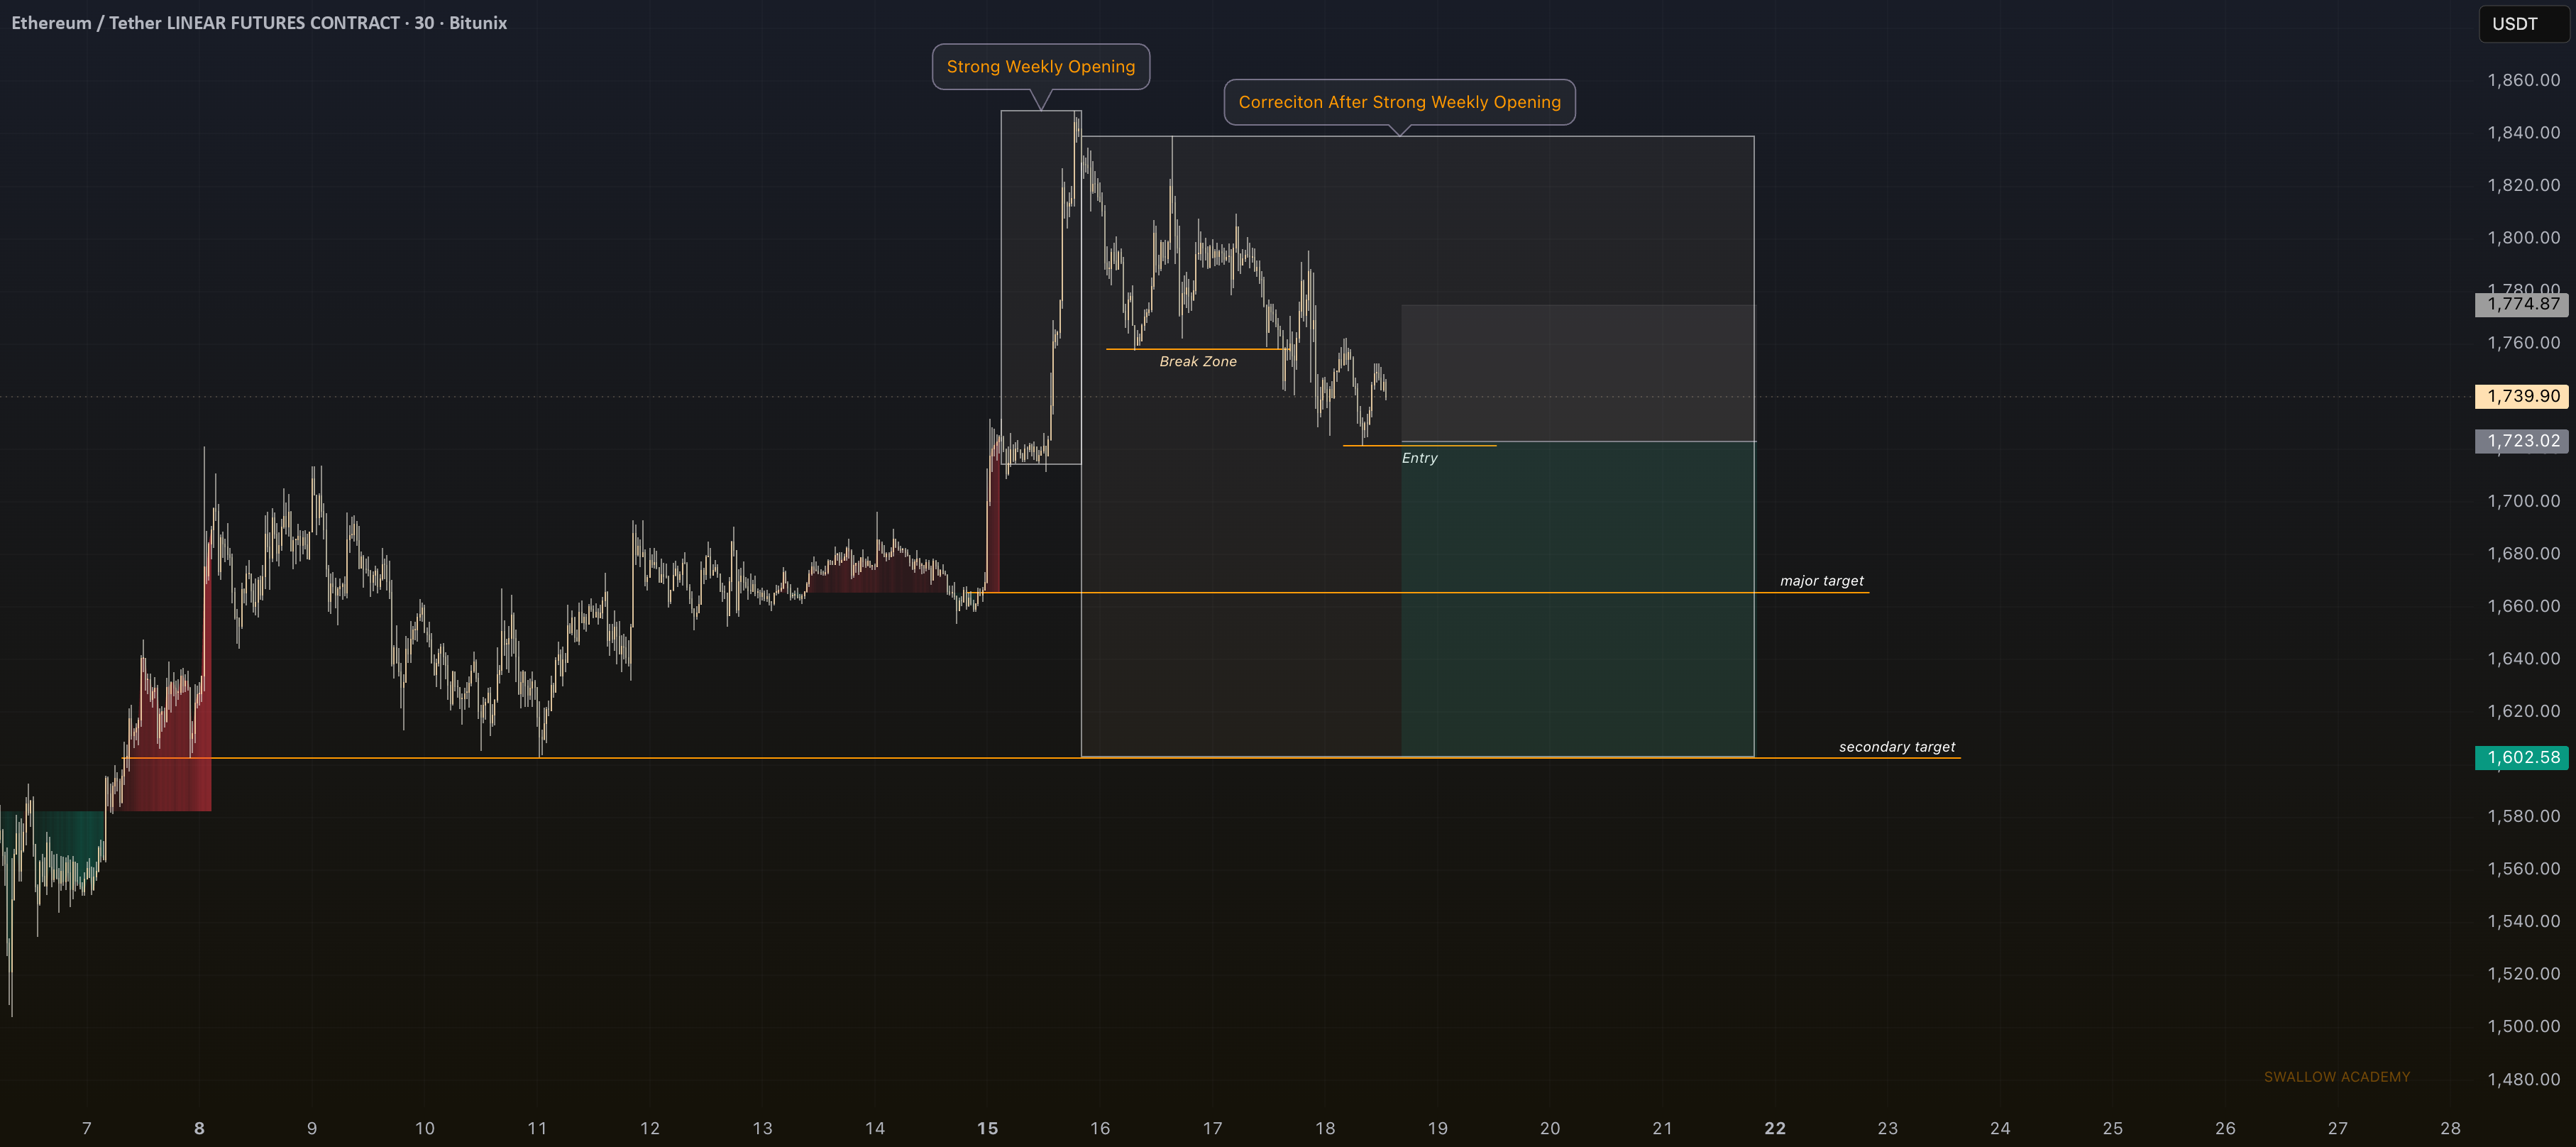
ETH/BTC Ratio Falls Back To Early-2023 Levels As Traders Debate Ethereum Value
An X analyst says ETH/BTC is back near 0.027, while a TradingView chart shows ET...
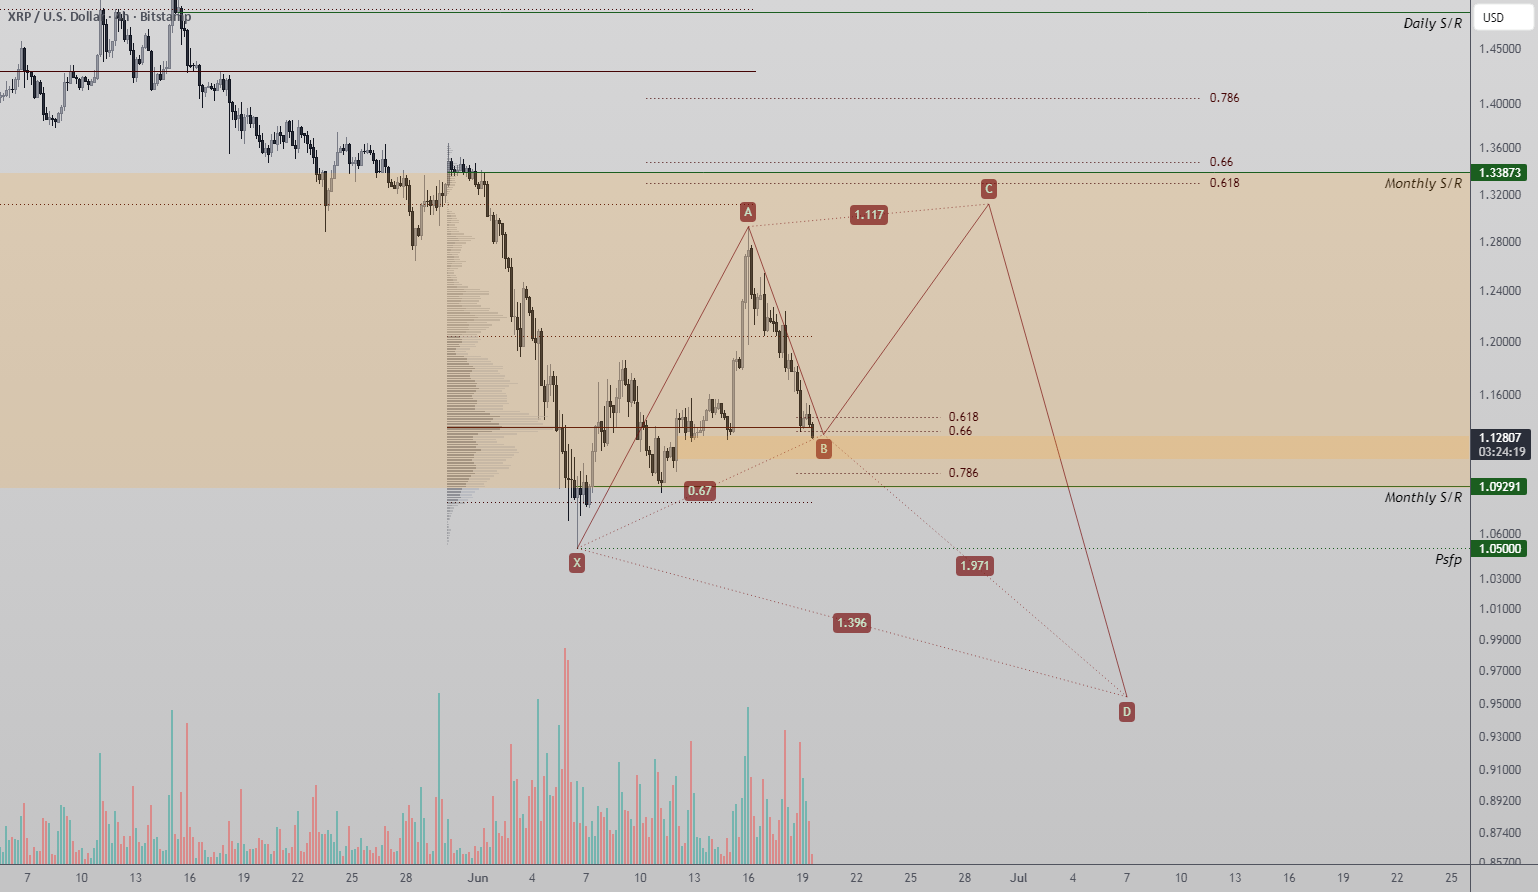
XRP Reversal Setup Forms Around Harmonic Pattern And Key Support Zone
A TradingView analyst says XRP is testing a technically important support zone s...