Bitcoin Price Builds for Surge, Bulls Eye Explosive Breakout
Alex Smith
2 hours ago

Bitcoin price started a decent increase above the $68,000 zone. BTC is now showing positive signs and might gain further if it clears $69,250.
- Bitcoin gained pace for a move above the $67,500 and $68,000 levels.
- The price is trading above $68,500 and the 100 hourly simple moving average.
- There was a break above a bearish trend line with resistance at $67,650 on the hourly chart of the BTC/USD pair (data feed from Kraken).
- The pair might start another decline if it stays below the $69,250 and $69,500 levels.
Bitcoin Price Gains Traction
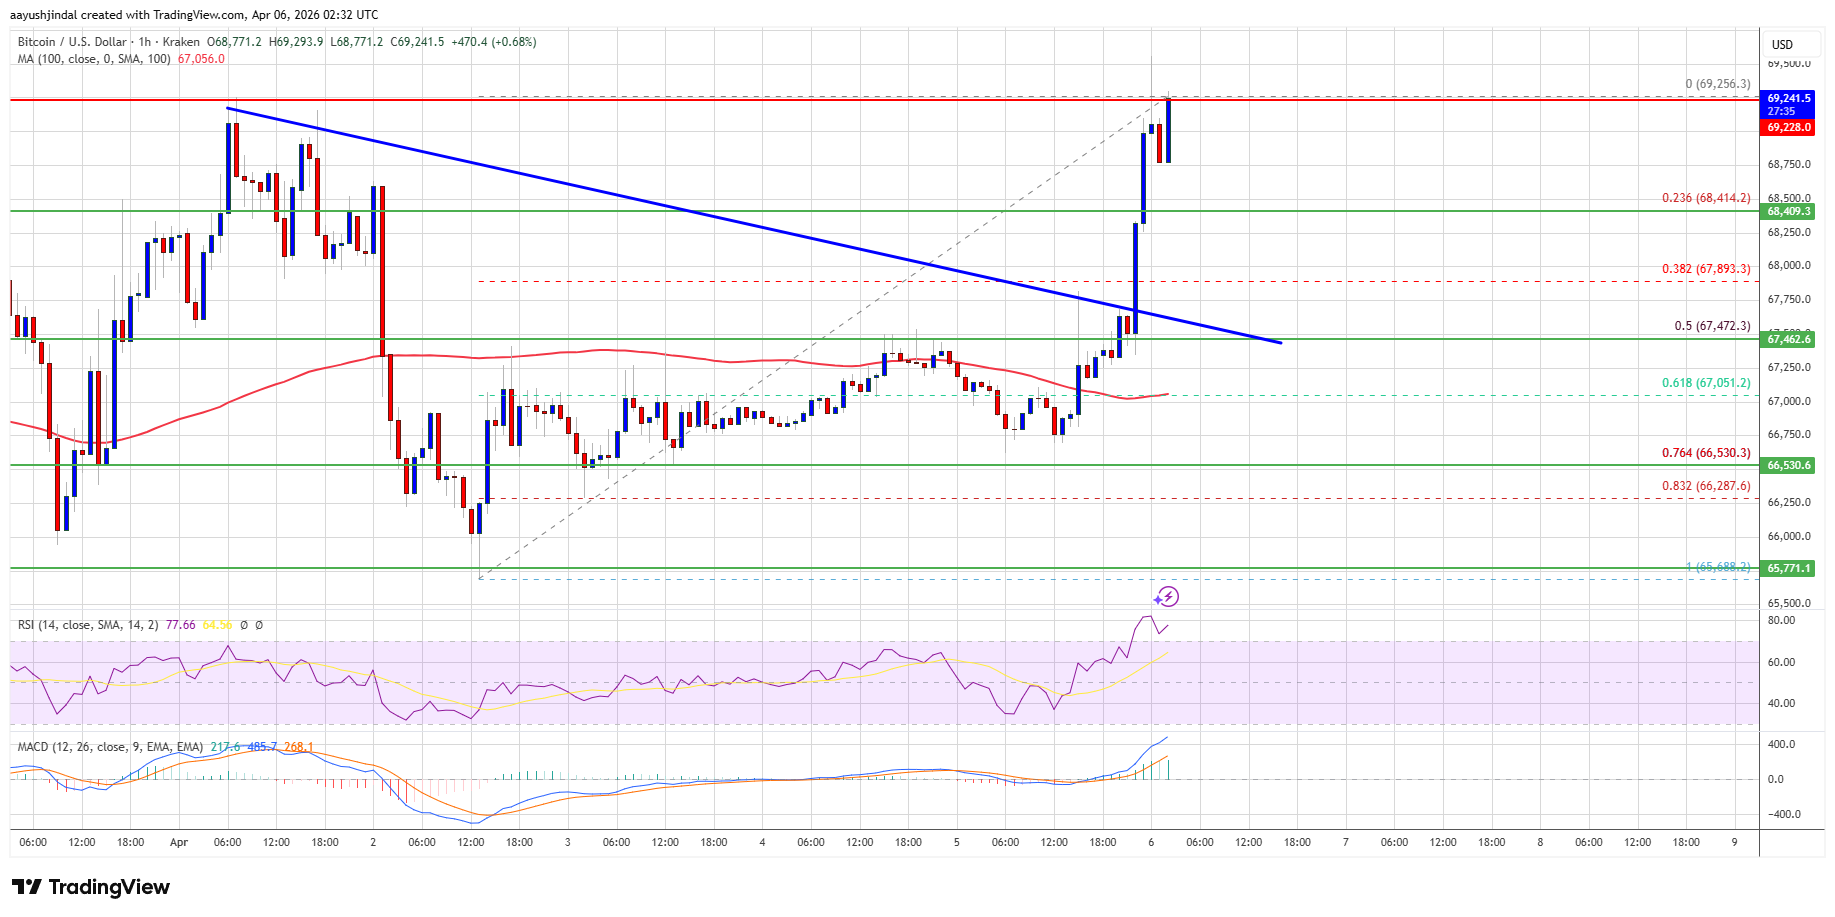
Bitcoin price managed to climb higher above the $67,250 resistance zone. BTC gained pace for a move above the $67,500 and $68,000 levels.
There was a break above a bearish trend line with resistance at $67,650 on the hourly chart of the BTC/USD pair. The pair even climbed above $69,000. A high is formed at $69,256, and the price is now consolidating above the 23.6% Fib retracement level of the upward move from the $65,688 swing low to the $69,256 high.
Bitcoin is now trading above $68,000 and the 100 hourly simple moving average. If the price remains stable above $68,500, it could attempt a fresh increase. Immediate resistance is near the $69,250 level.
The first key resistance is near the $69,500 level. A close above the $69,500 resistance might send the price further higher. In the stated case, the price could rise and test the $70,000 resistance. Any more gains might send the price toward the $71,500 level. The next barrier for the bulls could be $72,000.
Another Decline In BTC?
If Bitcoin fails to rise above the $69,250 resistance zone, it could start another decline. Immediate support is near the $68,800 level. The first major support is near the $68,500 level.
The next support is now near the $67,500 zone or the 50% Fib retracement level of the upward move from the $65,688 swing low to the $69,256 high. Any more losses might send the price toward the $67,000 support in the near term. The main support now sits at $66,500, below which BTC might struggle to recover in the near term.
Technical indicators:
Hourly MACD – The MACD is now gaining pace in the bullish zone.
Hourly RSI (Relative Strength Index) – The RSI for BTC/USD is now above the 50 level.
Major Support Levels – $68,500, followed by $68,000.
Major Resistance Levels – $69,250 and $69,500.
Related Articles
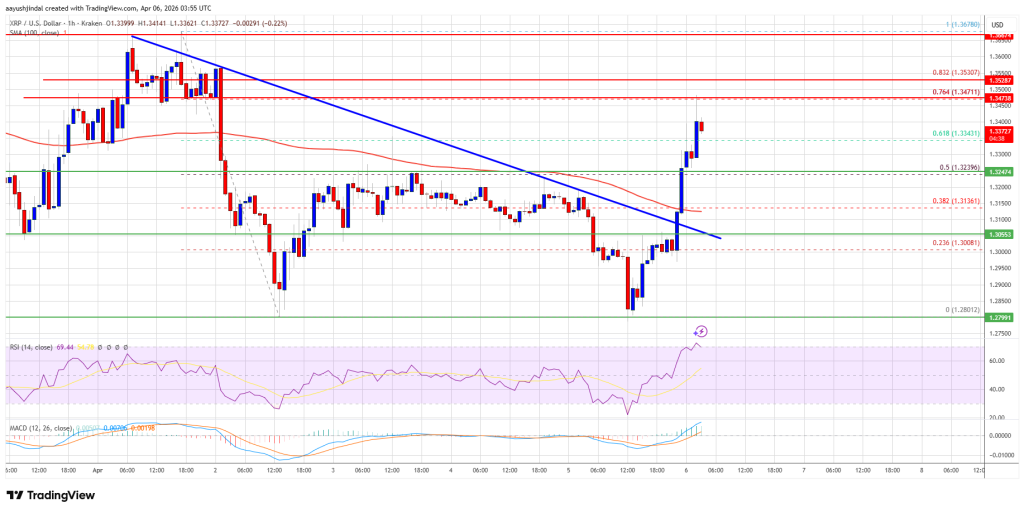
XRP Price Gains Ground, Traders Question Strength of Rally
XRP price started a recovery wave above $1.3200 and $1.3220. The price is now co...
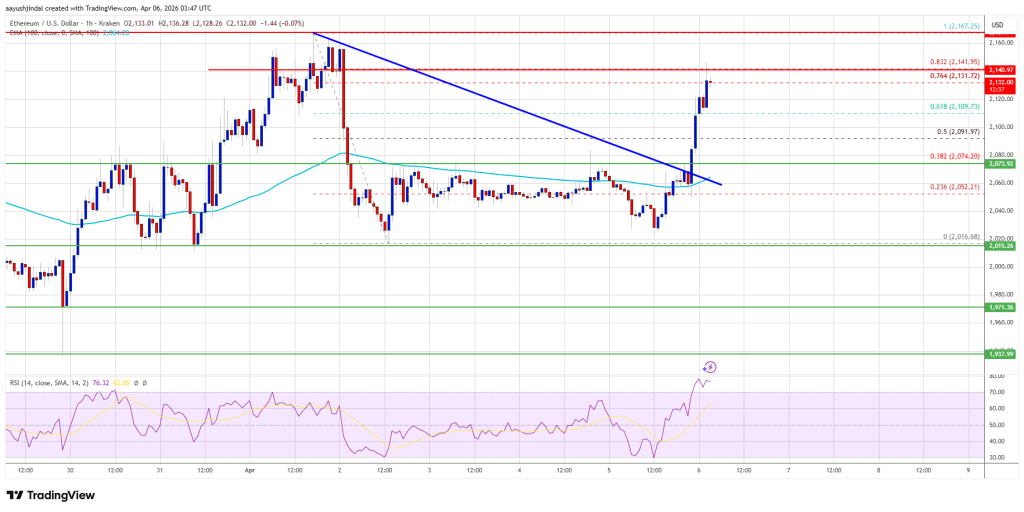
Ethereum Price Charges Higher, $2,150 Resistance Under Threat
Ethereum price managed to stay above $2,020 and recovered losses. ETH is now ris...

Analyst Identifies $63,000 As Key Support For Next Bitcoin Move
A popular crypto trader has come forward on the social media platform X to predi...

Ethereum Net Taker Volume Rises To Most Positive Level Since 2023 – Bullish Reversal Soon?
The price of Ethereum has been hovering around $2,000 for nearly a month, with t...