Bitcoin Price Downtrend Gains Pace, Recovery Hopes Continue To Fade
Alex Smith
3 hours ago
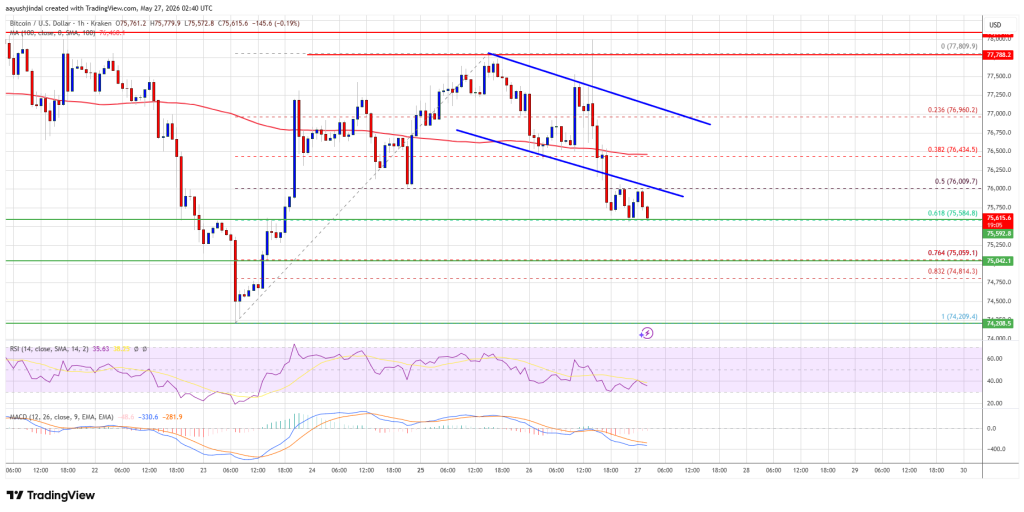
Bitcoin price started a downside correction from the $77,800 zone. BTC is showing bearish signs and might continue lower below $75,500.
- Bitcoin failed to stay above $77,000 and extended losses.
- The price is trading below $76,800 and the 100 hourly simple moving average.
- There was a break below a declining channel with support at $76,250 on the hourly chart of the BTC/USD pair (data feed from Kraken).
- The pair might extend losses if it stays below the $76,200 and $76,500 levels.
Bitcoin Price Dips Further
Bitcoin price failed to clear the $77,500 resistance zone. BTC started a downside correction and declined below the key support at $76,500 to enter a bearish zone.
There was a move below the 50% Fib retracement level of the upward move from the $74,210 swing low to the $77,810 high. Besides, there was a break below a declining channel with support at $76,250 on the hourly chart of the BTC/USD pair.
Bitcoin is now trading below $76,500 and the 100 hourly simple moving average. If the price remains stable above $75,500, it could attempt a fresh increase. Immediate resistance is near the $76,000 level. The first key resistance is near the $76,250 level.
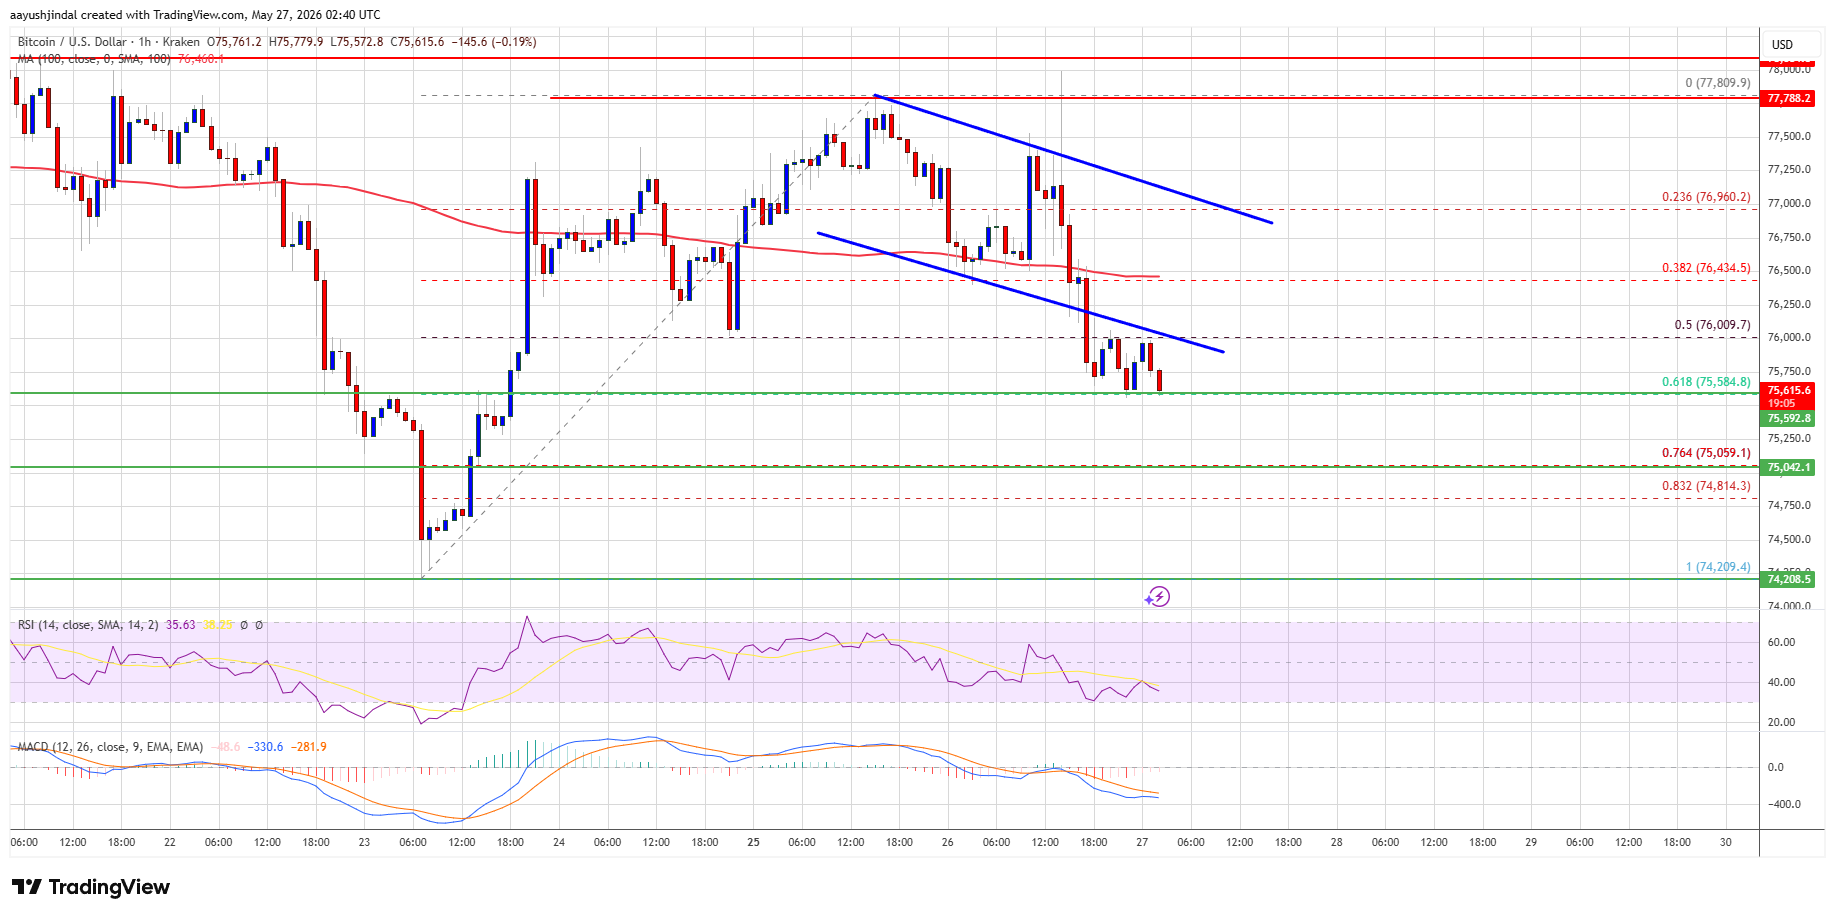
A close above the $76,250 resistance might send the price further higher. In the stated case, the price could rise and test the $77,000 resistance. The next resistance could be near the $77,200 level. Any more gains might send the price toward the $78,000 level. The main hurdle for the bulls could be $79,500.
Downside Extension In BTC?
If Bitcoin fails to rise above the $76,500 resistance zone, it could start another decline. Immediate support is near the $75,550 level or the 61.8% Fib retracement level of the upward move from the $74,210 swing low to the $77,810 high.
The first major support is near the $75,000 level. The next support is now near the $74,200 zone. Any more losses might send the price toward the $74,000 support in the near term. The main support now sits at $73,500, below which BTC might struggle to recover in the near term.
Technical indicators:
Hourly MACD – The MACD is now gaining pace in the bearish zone.
Hourly RSI (Relative Strength Index) – The RSI for BTC/USD is now below the 50 level.
Major Support Levels – $74,200, followed by $73,500.
Major Resistance Levels – $76,500 and $77,000.
Related Articles
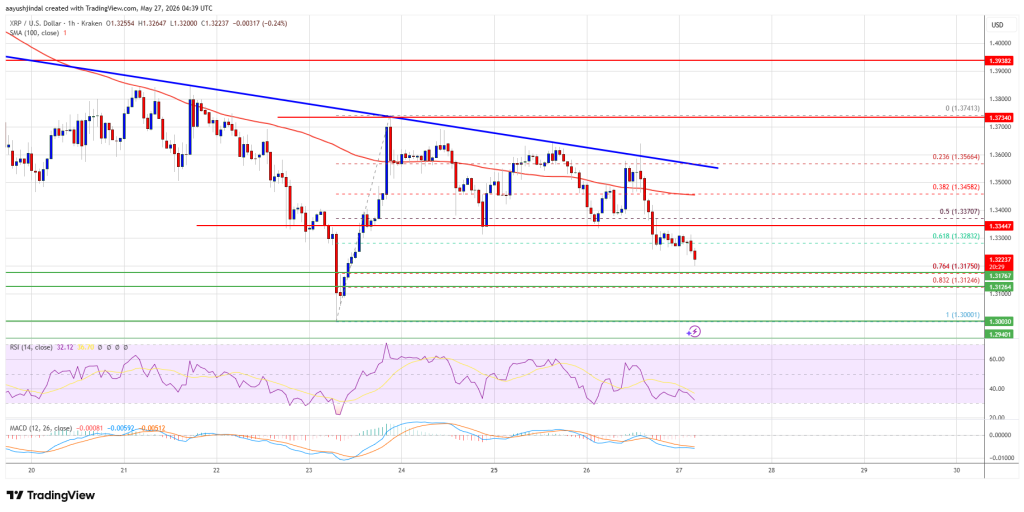
XRP Price Under Pressure Again, Traders Eye Possible Weekly Breakdown
XRP price started a downside correction below the $1.350 zone. The price is now...
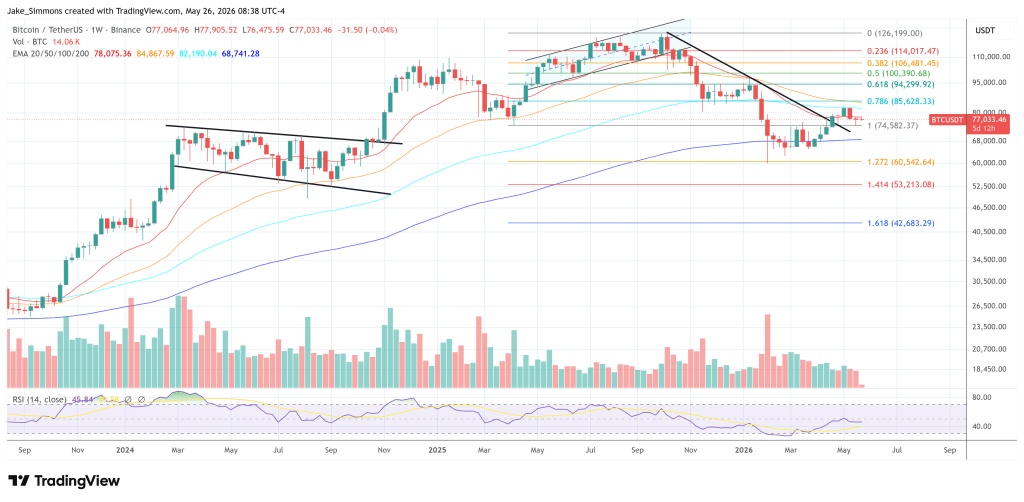
Bitcoin Could Fall To $40,000 If Saylor’s Bid Stalls, Ran Neuner Warns
Ran Neuner says Bitcoin’s chart structure is starting to resemble the breakdown...
Ethereum Price Struggles Near Key Levels As Market Sentiment Weakens
Ethereum price started a fresh decline and traded below $2,080. ETH is now conso...
Render Jumps 30% As Key On-Chain Metrics Break Out
Render has surged back to a 4-month high as demand for AI infrastructure has gro...