Bitcoin Price Extends Surge, $95K Resistance Emerges as Next Barrier
Alex Smith
1 month ago
Bitcoin price started a fresh increase above $92,000. BTC is now showing bullish signs but might struggle to clear the $95,000 resistance zone.
- Bitcoin started a fresh increase above the $92,200 zone.
- The price is trading above $92,500 and the 100 hourly Simple moving average.
- There is a key bullish trend line forming with support at $92,650 on the hourly chart of the BTC/USD pair (data feed from Kraken).
- The pair might continue to move up if it stays above the $92,000 zone.
Bitcoin Price Reaches Key Resistance
Bitcoin price remained supported above the $91,200 zone and started a fresh increase. BTC gained pace for a move above the $92,000 and $92,200 resistance levels.
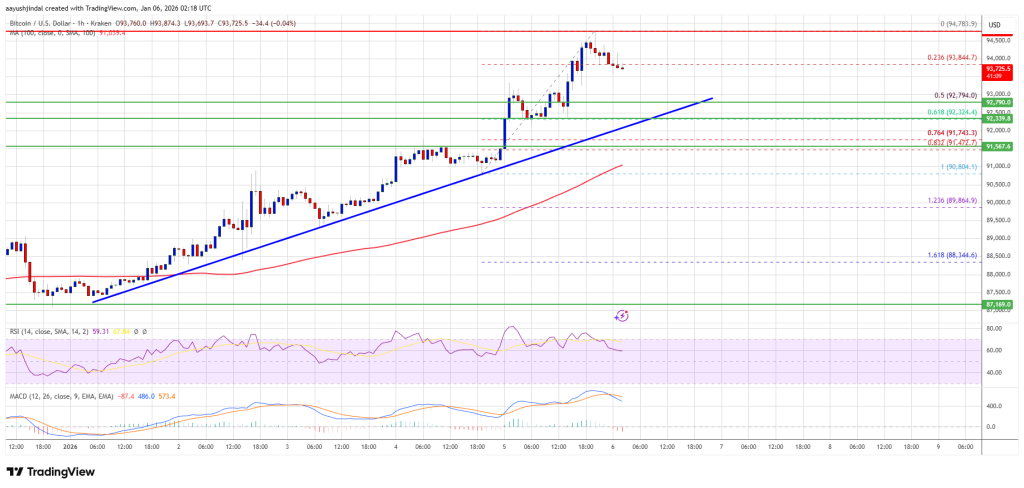
It even surpassed $94,000. A new multi-week high was formed at $94,783 and the price is now consolidating gains. There was a minor decline below the 23.6% Fib retracement level of the recent upward move from the $90,805 swing low to the $94,783 high.
Bitcoin is now trading above $92,500 and the 100 hourly Simple moving average. Besides, there is a key bullish trend line forming with support at $92,650 on the hourly chart of the BTC/USD pair.
If the price remains stable above $92,500, it could attempt a fresh increase. Immediate resistance is near the $94,200 level. The first key resistance is near the $94,500 level. The next resistance could be $95,000. A close above the $95,000 resistance might send the price further higher.
In the stated case, the price could rise and test the $95,800 resistance. Any more gains might send the price toward the $96,500 level. The next barrier for the bulls could be $97,000 and $97,200.
Downside Correction In BTC?
If Bitcoin fails to rise above the $94,500 resistance zone, it could start another decline. Immediate support is near the $93,200 level. The first major support is near the $92,800 level or the 50% Fib retracement level of the recent upward move from the $90,805 swing low to the $94,783 high.
The next support is now near the $92,500 zone. Any more losses might send the price toward the $91,200 support in the near term. The main support sits at $90,000, below which BTC might accelerate lower in the near term.
Technical indicators:
Hourly MACD – The MACD is now losing pace in the bullish zone.
Hourly RSI (Relative Strength Index) – The RSI for BTC/USD is now above the 50 level.
Major Support Levels – $92,800, followed by $92,500.
Major Resistance Levels – $94,500 and $95,000.
Related Articles

Bitcoin Trapped In Bear Market Woes As Liquidity Runs Dry, Is Another Crash Coming?
Bitcoin’s price structure is showing signs of strain, and new data from CryptoQu...
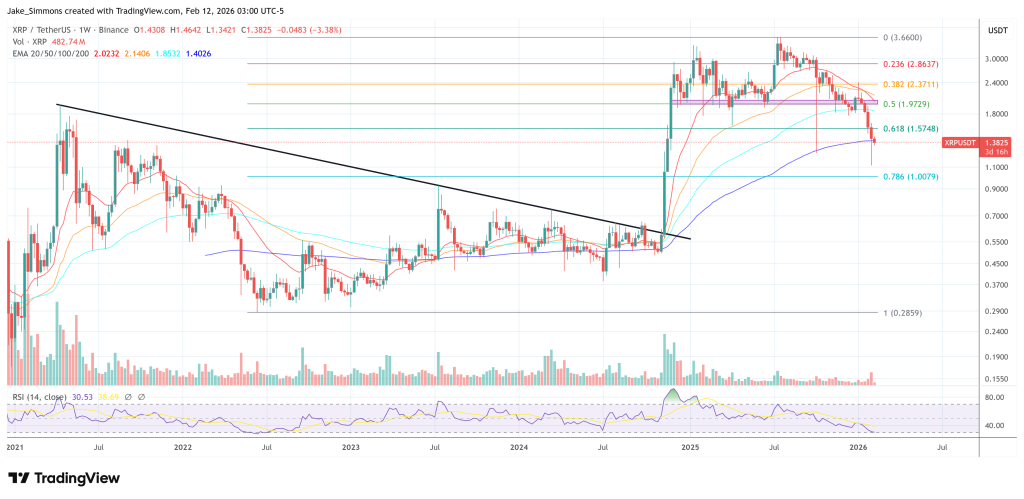
XRP Community Day Recap: The 7 Most Bullish Takeaways
Ripple used XRP Community Day to tighten its message: XRP is not an accessory to...
Is Bitcoin Already Pricing A US Recession? Analyst Sees Major Risk‑Reward Setup
Bitcoin’s (BTC) recent pullback may be less about crypto‑specific weakness and m...

LayerZero (ZRO) Soars 40% Amid Zero Blockchain Debut, Major Institutional Backing
ZRO, the native token of the omnichain interpretability protocol LayerZero, has...