Bitcoin Price Pullback Tests Bulls — Bounce Attempt Incoming?
Alex Smith
2 hours ago

Bitcoin price started a recovery wave above the $68,500 zone. BTC is now consolidating and might aim for more gains above $70,500.
- Bitcoin started a decent recovery wave above the $69,200 zone.
- The price is trading above $68,500 and the 100 hourly simple moving average.
- There was a break below a bullish trend line with support at $70,400 on the hourly chart of the BTC/USD pair (data feed from Kraken).
- The pair might dip again if it trades below the $69,280 and $68,000 levels.
Bitcoin Price Fails Near Resistance
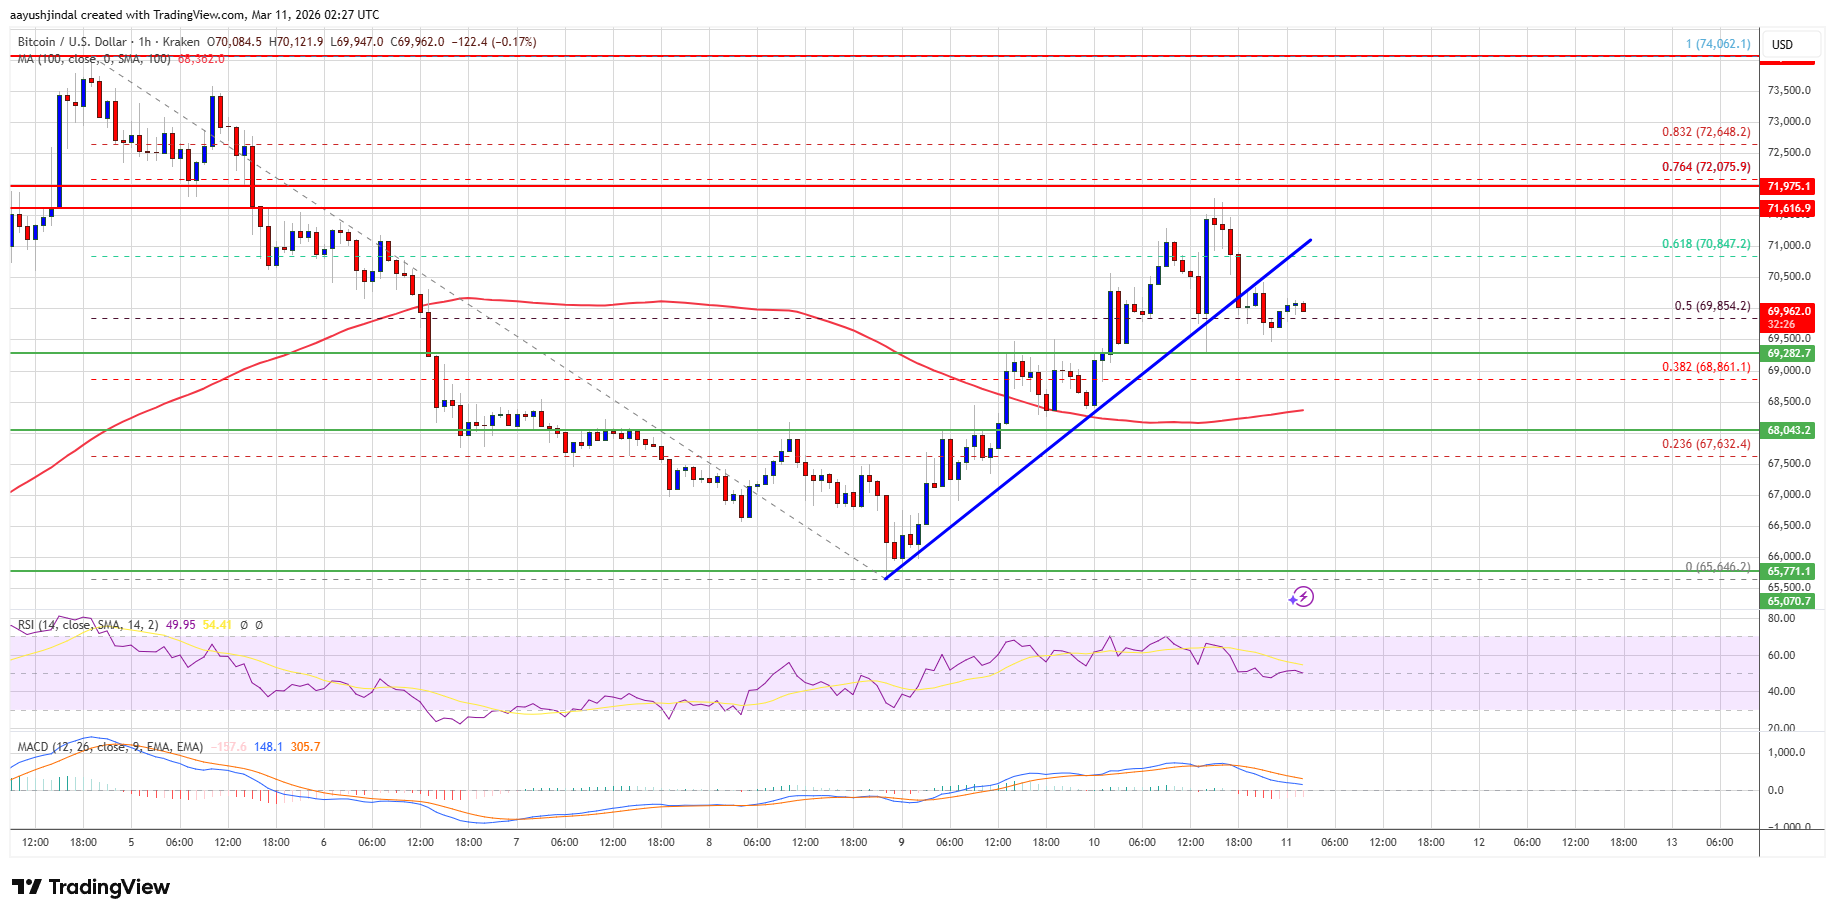
Bitcoin price remained elevated and extended its increase above the $68,500 level. BTC climbed above the $69,200 and $70,000 resistance levels.
The bulls pushed the price above the 61.8% Fib retracement level of the downward move from the $74,062 swing high to the $65,646 low. However, the bears are still active below $72,000. The price faced rejection near the $71,600 level and started a downside correction.
There was a break below a bullish trend line with support at $70,400 on the hourly chart of the BTC/USD pair. Bitcoin is now trading above $68,500 and the 100 hourly simple moving average. If the price remains stable above $68,500, it could attempt a fresh increase. Immediate resistance is near the $70,250 level.
The first key resistance is near the $70,500 level. A close above the $70,500 resistance might send the price further higher. In the stated case, the price could rise and test the $71,500 resistance. Any more gains might send the price toward the $72,000 level or the 76.4% Fib retracement level of the downward move from the $74,062 swing high to the $65,646 low. The next barrier for the bulls could be $72,650.
More Losses In BTC?
If Bitcoin fails to rise above the $70,500 resistance zone, it could start another decline. Immediate support is near the $69,280 level. The first major support is near the $68,500 level.
The next support is now near the $68,000 zone. Any more losses might send the price toward the $67,250 support in the near term. The main support now sits at $66,500, below which BTC might struggle to recover in the near term.
Technical indicators:
Hourly MACD – The MACD is now gaining pace in the bearish zone.
Hourly RSI (Relative Strength Index) – The RSI for BTC/USD is now near the 50 level.
Major Support Levels – $68,500, followed by $68,000.
Major Resistance Levels – $70,500 and $72,000.
Related Articles

Bitcoin Robbery: French Couple Held Hostage As Fake Cops Steal €900K in BTC
Three individuals stole almost $1M on Bitcoin from a couple at knife point at th...

XRP Price its Wall at $1.45, Downside Risks Begin Building
XRP price failed to stay above $1.40 and started a downside correction. The pric...

TRON Joins Agentic AI Foundation As AI Systems Move Toward Real-World Deployment
TRON has joined the Agentic AI Foundation (AAIF), an open initiative under the L...
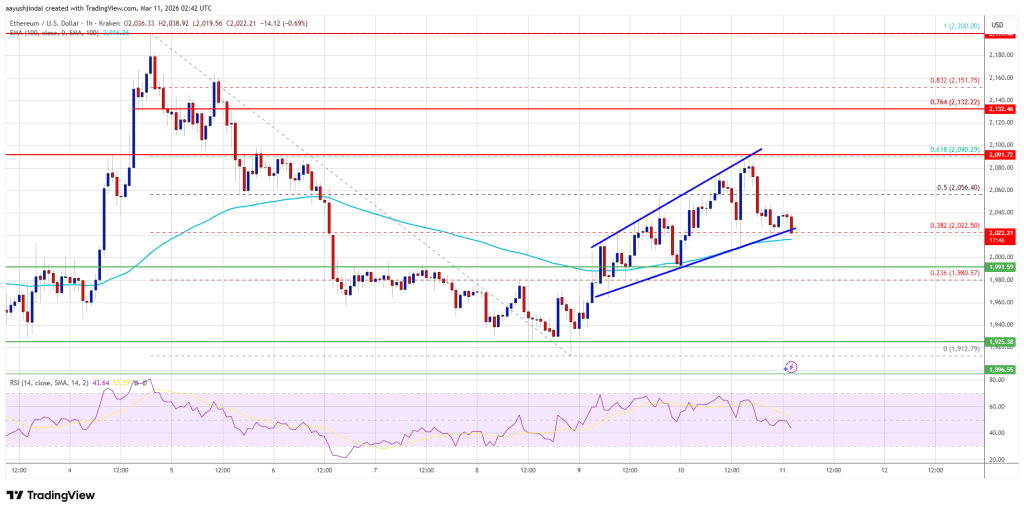
Ethereum Price Rejected Again, Market Watches Key Support Closely
Ethereum price started a recovery wave above the $2,000 zone. ETH is now struggl...