Bitcoin Price Recovery Slips, Sellers Tighten Grip on Market
Alex Smith
2 hours ago

Bitcoin price started a recovery wave above $68,000. BTC is now struggling to surpass $68,800 and showing signs of a fresh decline.
- Bitcoin failed to settle above $68,800 and trimmed most gains.
- The price is trading below $67,200 and the 100 hourly simple moving average.
- There was a break below a rising channel with support at $67,200 on the hourly chart of the BTC/USD pair (data feed from Kraken).
- The pair might start another decline if it stays below the $68,000 and $67,800 levels.
Bitcoin Price Faces Rejection
Bitcoin price formed a base above $66,500 and started a recovery wave. BTC was able to settle above $67,200 to move into a short-term positive zone.
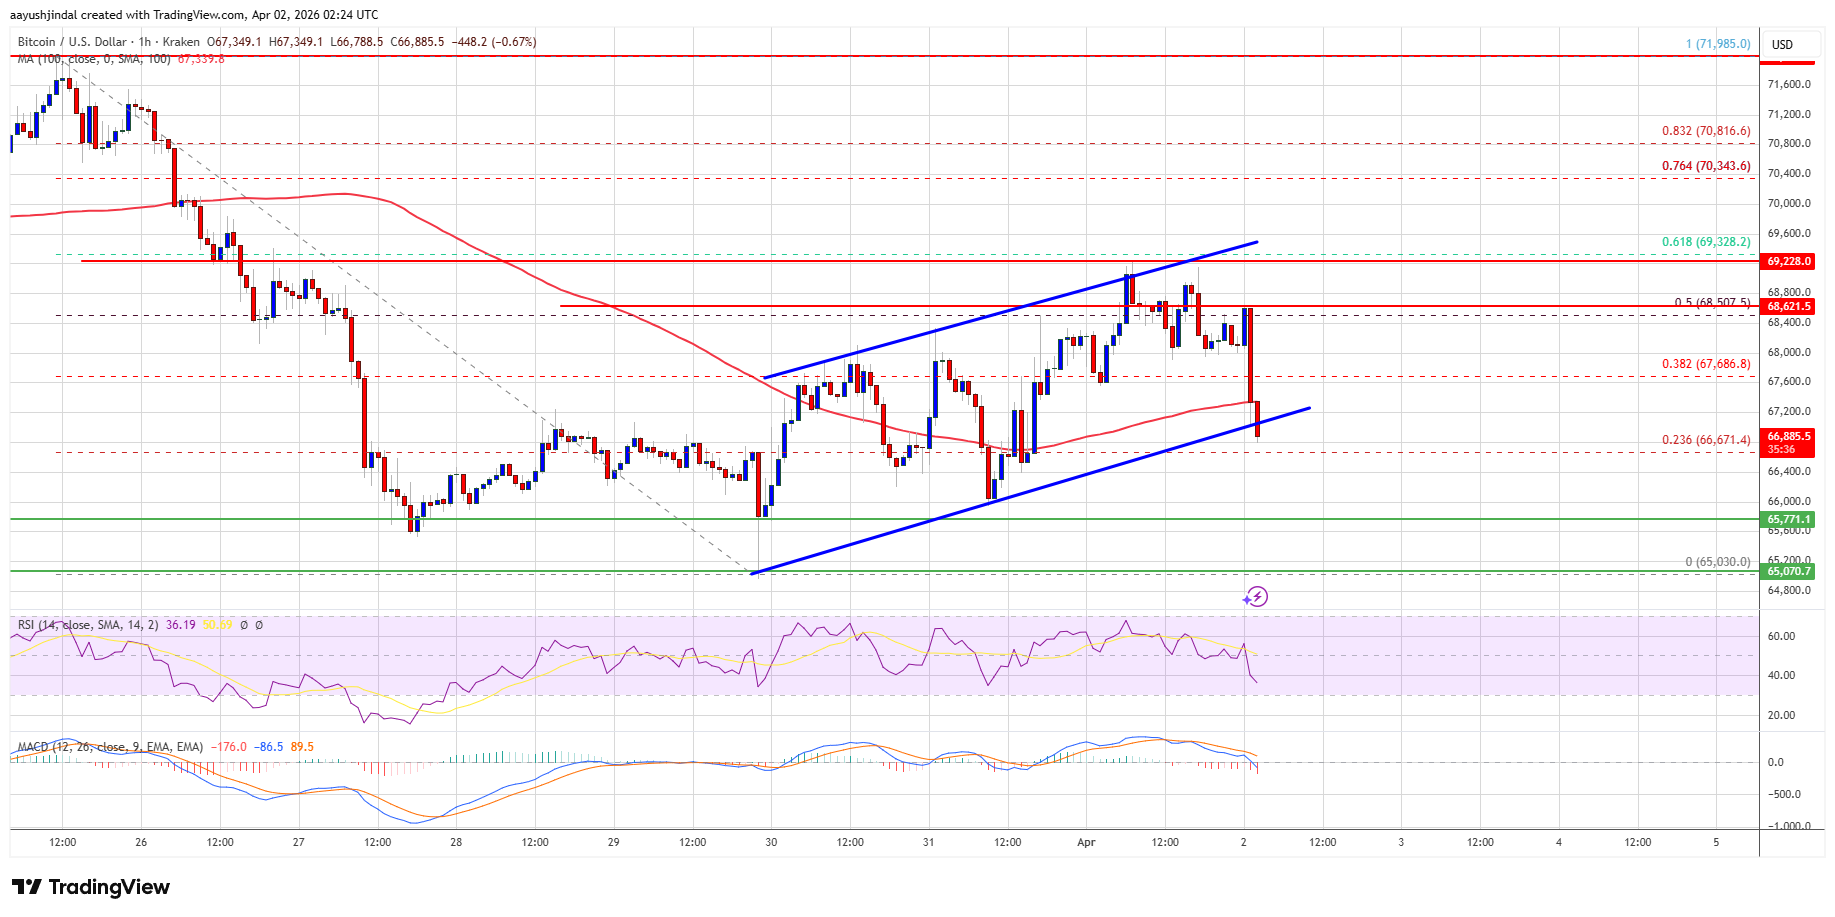
The price climbed above the $67,500 resistance zone. The bulls even cleared the 38.2% Fib retracement level of the downward move from the $71,985 swing high to the $65,030 low. However, the bears were active near the $69,200 resistance zone.
The price failed to clear the 61.8% Fib retracement level of the downward move from the $71,985 swing high to the $65,030 low. There was a fresh bearish reaction and there was a break below a rising channel with support at $67,200 on the hourly chart of the BTC/USD pair.
Bitcoin is now trading below $67,200 and the 100 hourly simple moving average. If the price remains stable above $66,000, it could attempt a fresh increase. Immediate resistance is near the $67,800 level.
The first key resistance is near the $68,500 level. A close above the $68,500 resistance might send the price further higher. In the stated case, the price could rise and test the $69,250 resistance. Any more gains might send the price toward the $69,500 level. The next barrier for the bulls could be $70,000.
More Losses In BTC?
If Bitcoin fails to rise above the $68,000 resistance zone, it could start another decline. Immediate support is near the $66,000 level. The first major support is near the $65,750 level.
The next support is now near the $65,500 zone. Any more losses might send the price toward the $65,000 support in the near term. The main support now sits at $64,200, below which BTC might struggle to recover in the near term.
Technical indicators:
Hourly MACD – The MACD is now gaining pace in the bearish zone.
Hourly RSI (Relative Strength Index) – The RSI for BTC/USD is now below the 50 level.
Major Support Levels – $66,000, followed by $65,500.
Major Resistance Levels – $67,800 and $68,500.
Related Articles
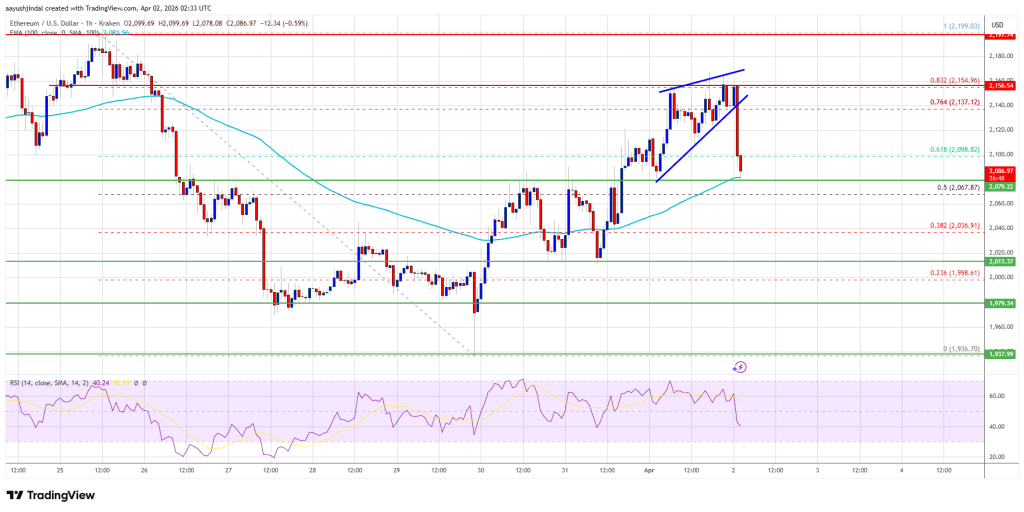
Ethereum Price Pressured at $2,150, Bulls Fight to Clear Hurdle
Ethereum price started a steady recovery wave above $2,050. ETH is now strugglin...
XRP Analyst Shares What To Expect Once Ripple Taps This $12.5 Trillion Industry
An XRP analyst has outlined the dramatic changes that could happen for the crypt...
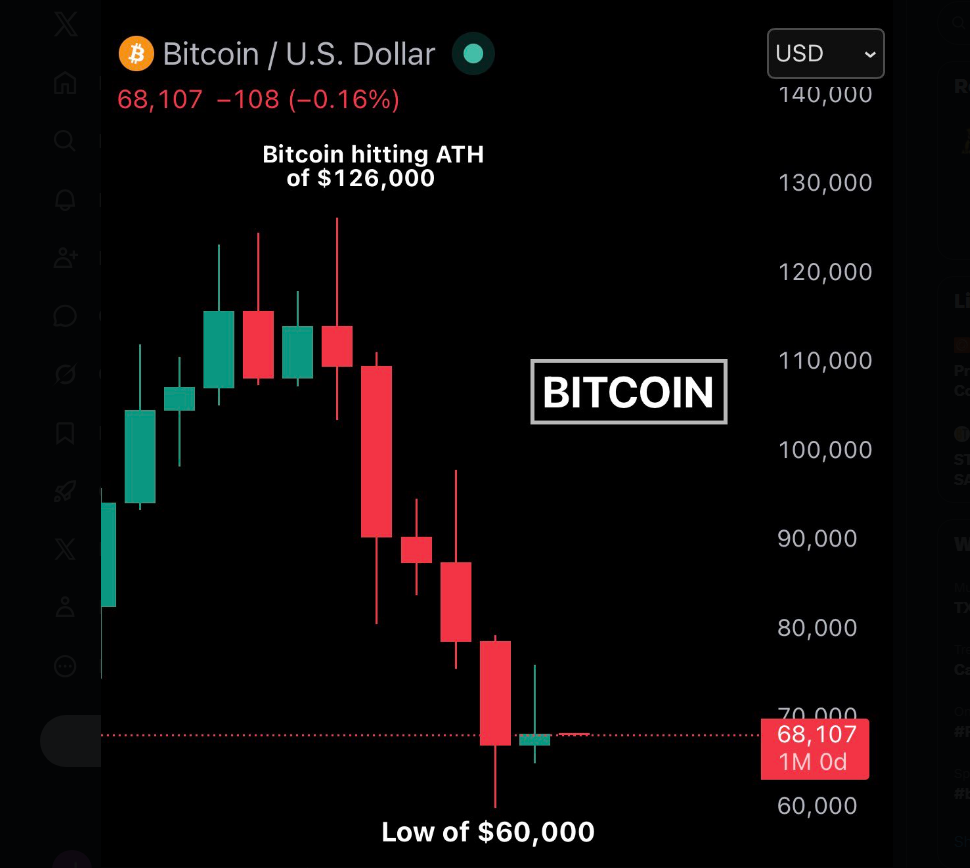
Bitcoin Ends 5-Month Losing Run — Real Reversal Or Just April Fool’s Hype?
A cluster of roughly 650,000 Bitcoin sits at the $70,000–$72,000 price range — c...
Is Bitcoin Safe From Quantum Computers? Satoshi Has This To Say
As quantum computing continues to evolve, questions about its potential impact o...