Bitcoin Price Sinks Below $68K, Downside Targets Come Into Focus
Alex Smith
14 hours ago

Bitcoin price started a fresh decline below $68,500 and $68,000. BTC is now consolidating and might struggle to start a recovery wave above $68,500.
- Bitcoin started a fresh decline after it settled above the $69,500 zone.
- The price is trading below $68,000 and the 100 hourly simple moving average.
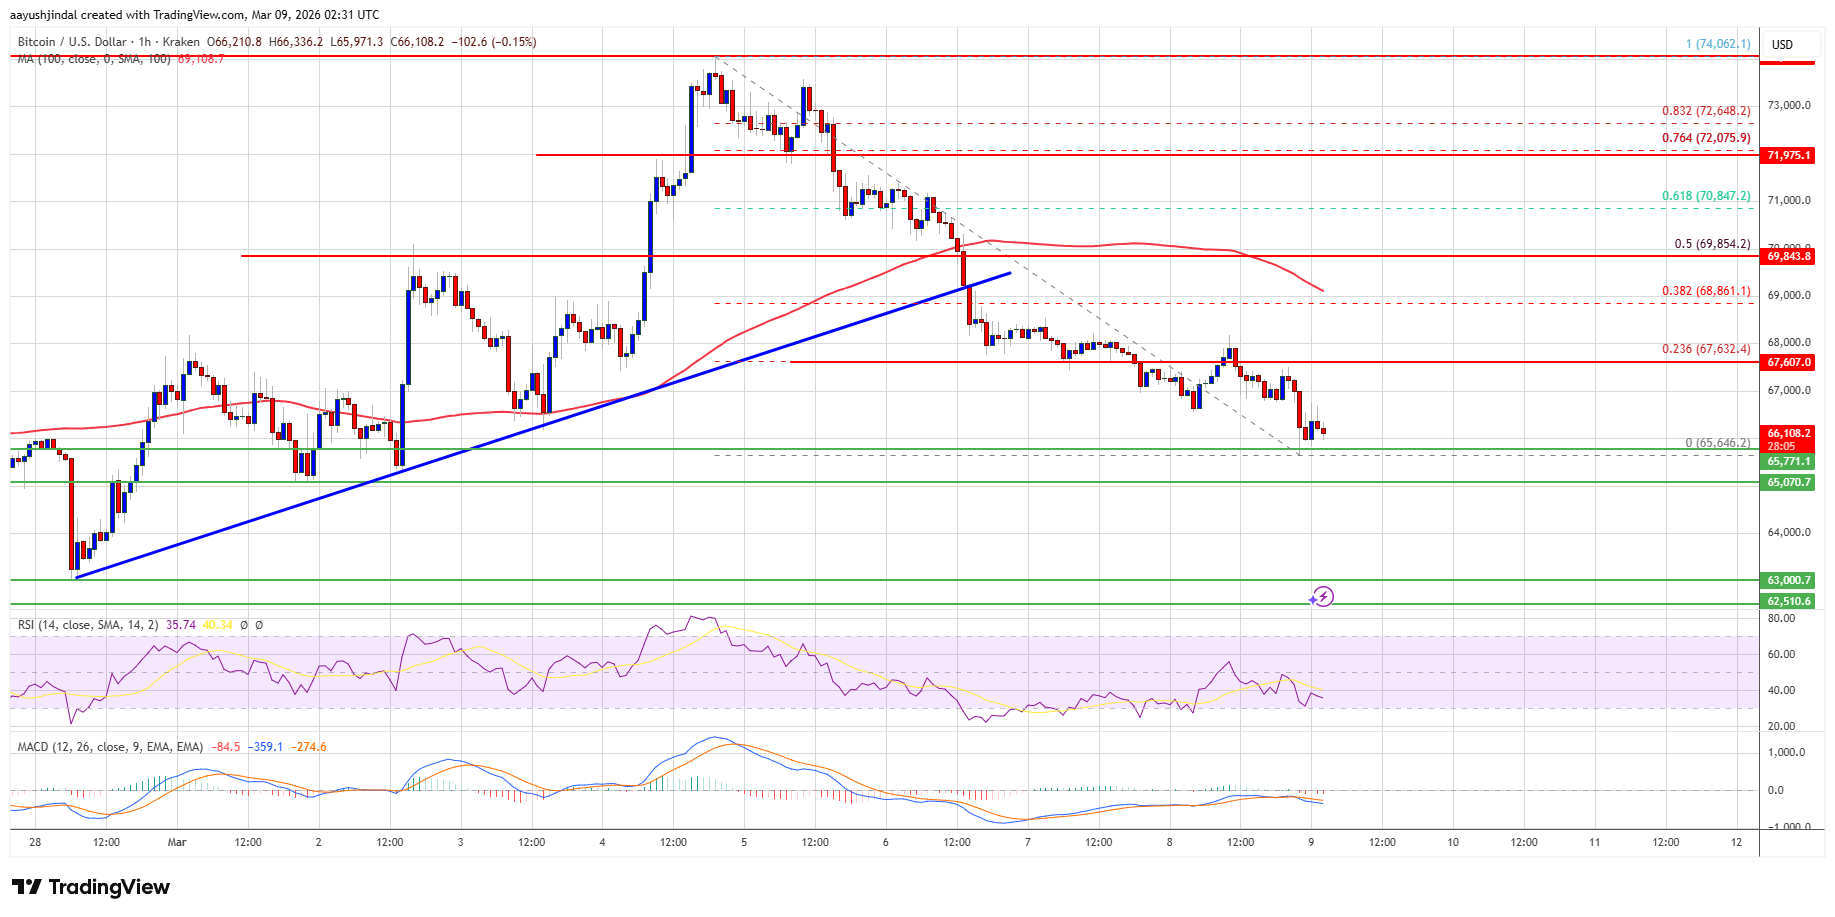
- There was a break below a major bullish trend line with support at $68,900 on the hourly chart of the BTC/USD pair (data feed from Kraken).
- The pair might dip again if it trades below the $65,500 and $65,000 levels.
Bitcoin Price Starts Another Decline
Bitcoin price failed to extend its increase above the $68,500 zone. BTC started a fresh decline after it settled below the $68,000 support zone.
The bears pushed the price below $67,500 and $67,200. Besides, there was a break below a major bullish trend line with support at $68,900 on the hourly chart of the BTC/USD pair. Finally, the price tested the $65,500 zone. A low was formed at $65,646, and the price is now consolidating losses.
Bitcoin is now trading below $68,000 and the 100 hourly simple moving average. If the price remains stable above $65,500, it could attempt a fresh increase. Immediate resistance is near the $67,000 level. The first key resistance is near the $67,600 level and the 23.6% Fib retracement level of the downward move from the $74,062 swing high to the $65,646 low.
A close above the $67,600 resistance might send the price further higher. In the stated case, the price could rise and test the $68,800 resistance. Any more gains might send the price toward the $68,800 level. The next barrier for the bulls could be $69,850 or the 50% Fib retracement level of the downward move from the $74,062 swing high to the $65,646 low.
More Losses In BTC?
If Bitcoin fails to rise above the $68,000 resistance zone, it could start another decline. Immediate support is near the $65,500 level. The first major support is near the $65,000 level.
The next support is now near the $63,500 zone. Any more losses might send the price toward the $62,000 support in the near term. The main support now sits at $61,200, below which BTC might struggle to recover in the near term.
Technical indicators:
Hourly MACD – The MACD is now gaining pace in the bearish zone.
Hourly RSI (Relative Strength Index) – The RSI for BTC/USD is now below the 50 level.
Major Support Levels – $65,500, followed by $65,000.
Major Resistance Levels – $68,000 and $68,800.
Related Articles

Expert Trader Shows ‘Simple Math’ To Calculate The Bitcoin Price Bottom
A crypto market analyst has outlined what he describes as a straightforward math...
SUI At Decision Point: RSI Trendline Could Trigger A Drop Or Bounce
SUI is approaching a key decision point as technical signals begin to shape its...
Bitcoin At The Bottom? The 23-Month Cycle That Has Never Failed
Crypto analyst Coinvo has explained why Bitcoin may be close to a bottom, which...

Why A U.S. Court Says Binance Is Not (Yet) Liable for Terrorist Crypto Flows
A lawsuit accusing the crypto exchange Binance of allowing terrorism financing b...