Bitcoin Price Upside Capped Again, $70K Proves Tough Ceiling
Alex Smith
2 hours ago
Bitcoin price started a decent increase above $68,000 but failed at $70,000. BTC is now consolidating and might aim for more gains above $69,200.
- Bitcoin started a fresh increase after it settled above the $67,500 support.
- The price is trading above $68,000 and the 100 hourly simple moving average.
- There was a break above a bearish trend line with resistance at $66,800 on the hourly chart of the BTC/USD pair (data feed from Kraken).
- The pair might dip again if it trades below the $67,400 and $67,000 levels.
Bitcoin Price Fails At $70,000
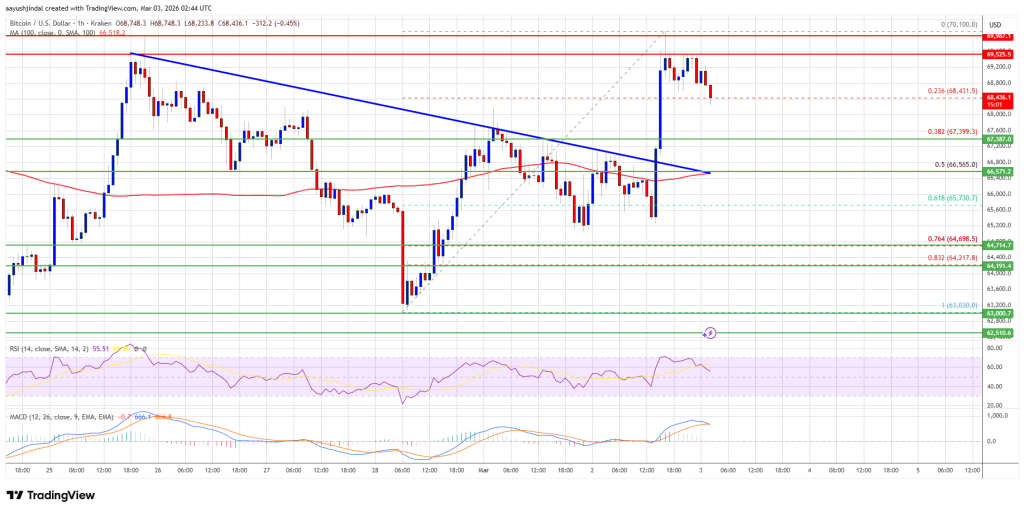
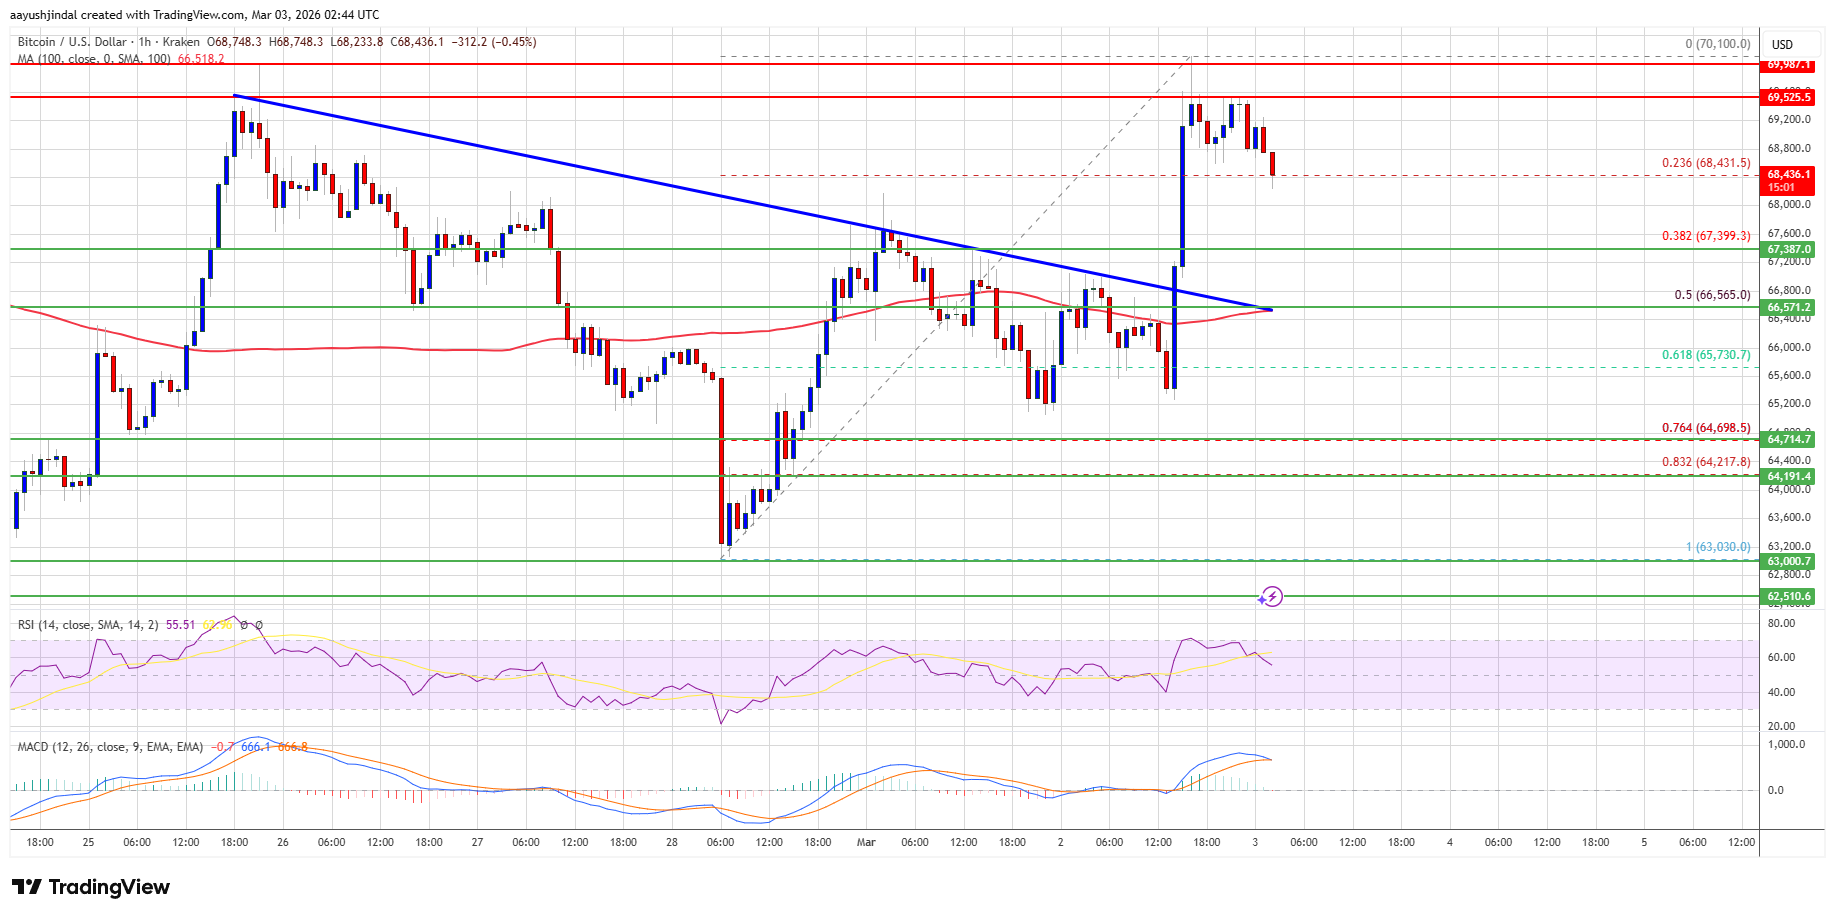
Bitcoin price managed to form a base above the $65,500 zone. BTC started a fresh increase and was able to surpass the $66,500 resistance zone.
The price even rallied above the $68,000 resistance. Besides, there was a break above a bearish trend line with resistance at $66,800 on the hourly chart of the BTC/USD pair. Finally, the bears appeared near $70,000. A high was formed at $70,100, and the price recently corrected some gains. There was a move below the 23.6% Fib retracement level of the upward move from the $63,030 swing low to the $70,100 high.
Bitcoin is now trading above $68,000 and the 100 hourly simple moving average. If the price remains stable above $67,500, it could attempt a fresh increase. Immediate resistance is near the $69,200 level.
The first key resistance is near the $69,500 level. A close above the $69,500 resistance might send the price further higher. In the stated case, the price could rise and test the $70,000 resistance. Any more gains might send the price toward the $70,500 level. The next barrier for the bulls could be $70,850 and $71,200.
Downside Continuation In BTC?
If Bitcoin fails to rise above the $70,000 resistance zone, it could start another decline. Immediate support is near the $68,000 level. The first major support is near the $67,500 level or the 50% Fib retracement level of the upward move from the $63,030 swing low to the $70,100 high.
The next support is now near the $65,650 zone. Any more losses might send the price toward the $65,000 support in the near term. The main support now sits at $64,200, below which BTC might struggle to recover in the near term.
Technical indicators:
Hourly MACD – The MACD is now losing pace in the bullish zone.
Hourly RSI (Relative Strength Index) – The RSI for BTC/USD is now above the 50 level.
Major Support Levels – $68,000, followed by $67,500.
Major Resistance Levels – $69,200 and $70,000.
Related Articles
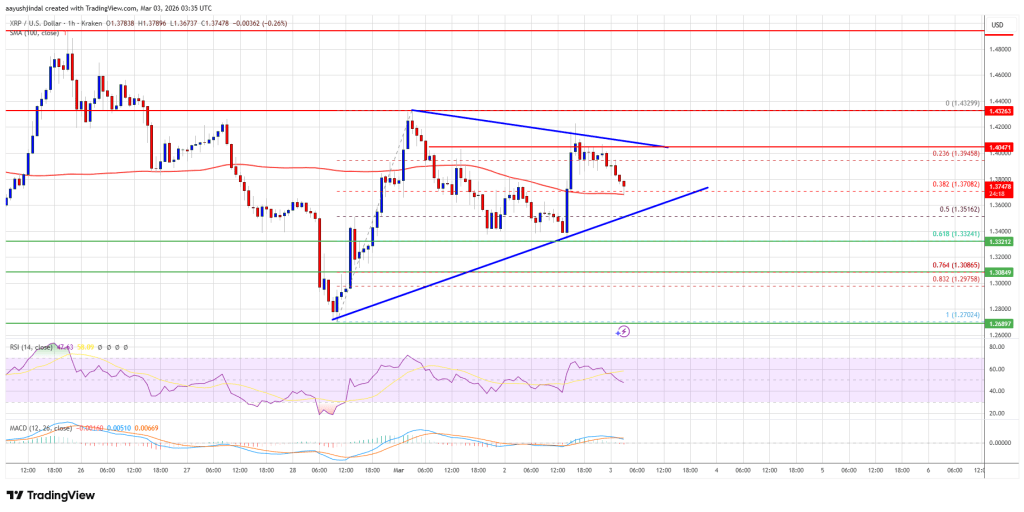
XRP Price Maintains Momentum as Traders Anticipate Breakout Rally
XRP price failed to surpass $1.4320 and started downside correction. The price i...

Next “Binance Killer”? Hyperliquid Now Dominates DeFi Derivatives, New Report Shows
Hyperliquid is no longer just the shiny new decentralized exchange for perpetual...
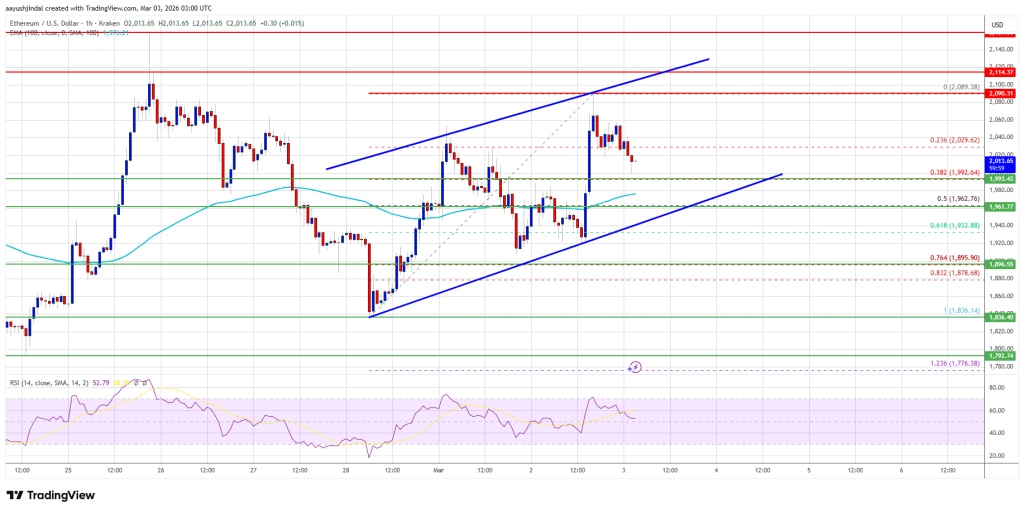
Ethereum Price Targets $2,150 Again, Bulls Seek Breakout Confirmation
Ethereum price started a fresh increase from $1,950. ETH is now consolidating ga...
Bitcoin Prints Fifth Straight Red Month; Previous Streak Was Followed By 300% Surge
Bitcoin (BTC) has wrapped up February with its fifth straight monthly loss, mark...