CEAT Shares Signal Near-Term Weakness; Check The Pattern And Details
Alex Smith
3 weeks ago

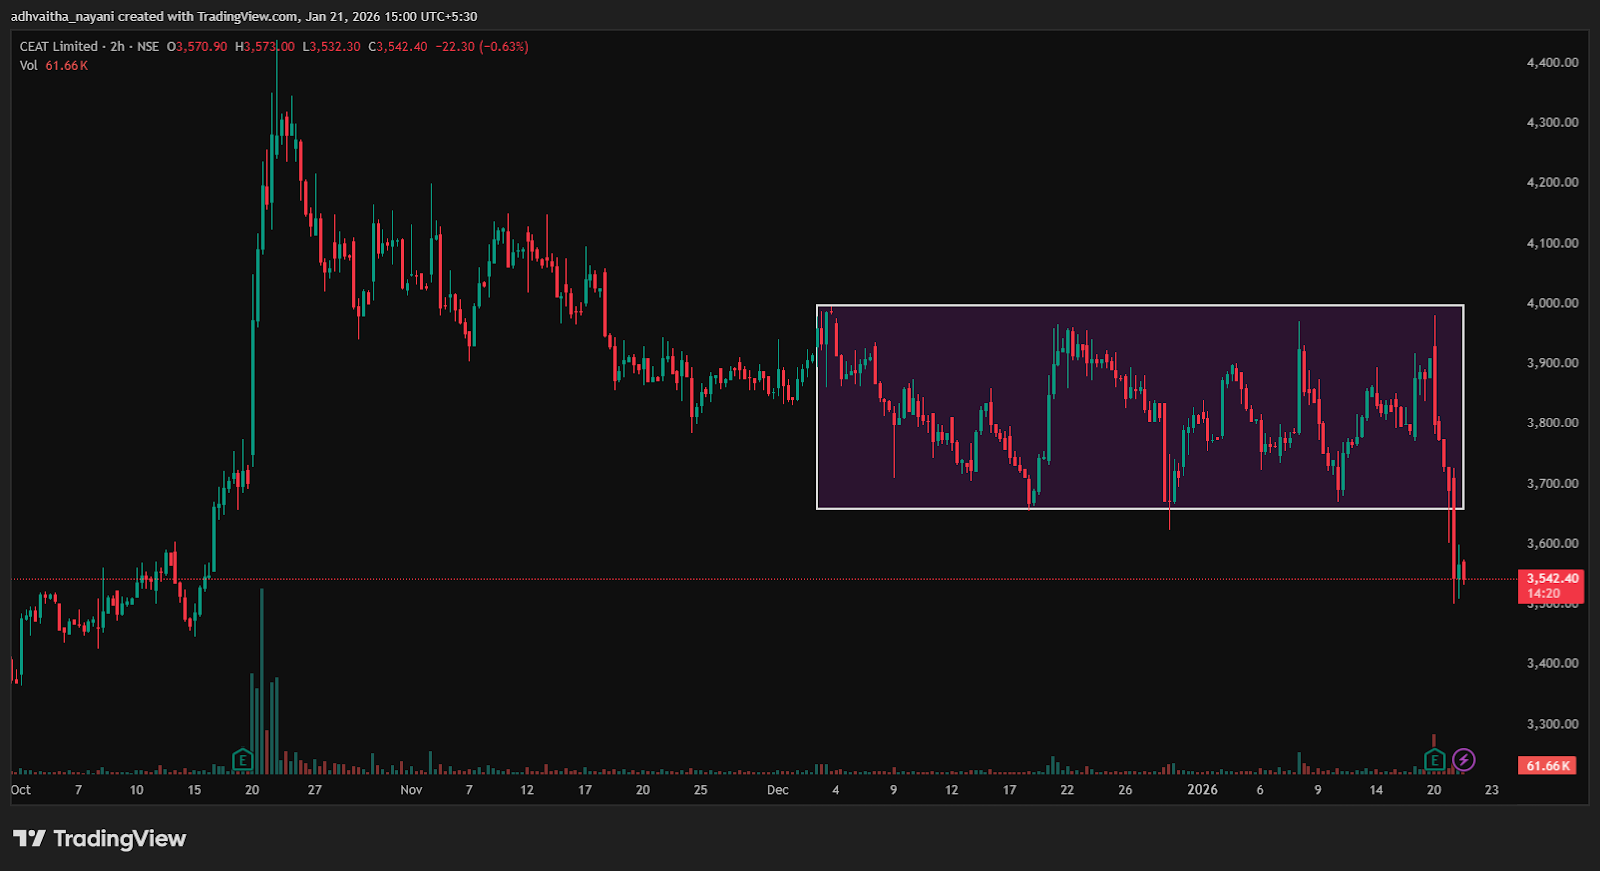
Synopsis: CEAT Ltd has formed a rectangular channel pattern on the 2-hour chart, with a downside breakout indicating a bearish bias.
CEAT Ltd, after a phase of sideways consolidation in recent sessions, has formed a rectangular channel pattern on its 2-hour chart, with a downside breakout indicating a potential bearish continuation.
The rectangular channel pattern represents a consolidation phase where price oscillates between parallel support and resistance levels. A decisive breakdown below the lower boundary signals a bearish continuation, indicating that sellers have gained control, and downside momentum may accelerate.
On Wednesday, the stock formed a lower high within the rectangular consolidation channel, before decisively breaking below the key support level of Rs 3,659 on Wednesday. The breakdown, coupled with subdued buying volumes, signals the emergence of near-term bearish momentum.
For a rectangular channel pattern, the downside target is calculated by measuring the height of the consolidation range and projecting that distance downward from the breakdown point. Traders typically use this projection to set profit targets, often booking partial or full gains near the target while reassessing positions as prices approach potential support zones.
(2-Hour Timeframe)
Indicator Confirmation
RSI: The daily RSI indicates persistent bearish momentum, as it declined from ~44 in the previous trading session to 37 on Wednesday, confirming the continuation of the downtrend.
MACD: The orange signal line crossed above the Blue MACD line, with the histogram turning red, indicating bearish momentum.
Moving Averages: On the 2-hour time frame, the 5-day moving average has crossed below the 9-day moving average, further confirming a bearish trend.
Price Volume Trend: The Price Volume Indicator confirmed the downtrend, supported by a sharp decline in buying volumes.
Implications
The breakdown from the bearish rectangular channel indicates scope for further downside. A sustained close below the key Rs 3,659 support, preferably accompanied by increased selling volume, would confirm the validity of the breakdown and reduce the risk of a false signal. The former support around Rs 3,659 has now turned into immediate resistance, and continued trading below this level would reinforce bearish control in the near term.
About the stock
CEAT Limited is a leading Indian tyre manufacturer and the first in its industry to receive the Deming Grand Prize. The company maintains an extensive network of over 61,000 touchpoints and partners with more than 50 original equipment manufacturers. Driven by innovation, it has filed 201 patents.
Over the past month, CEAT Ltd has declined by 9.84%, reflecting a phase of prolonged sideways consolidation. The stock is down 1.52% over the last six months and has registered a 19.80% gain over the past year. For more such technical stock ideas, Click here to view our research page.
Disclaimer: The views and investment tips expressed by investment experts/broking houses/rating agencies on tradebrains.in are their own, and not that of the website or its management. Investing in equities poses a risk of financial losses. Investors must therefore exercise due caution while investing or trading in stocks. Trade Brains Technologies Private Limited or the author are not liable for any losses caused as a result of the decision based on this article. Please consult your investment advisor before investing.
The post CEAT Shares Signal Near-Term Weakness; Check The Pattern And Details appeared first on Trade Brains.
Related Articles

Key U.S. Economic Events to Watch in February That Could Impact the Markets
Synopsis: This week’s economic calendar features several high-impact U.S. data r...

Stock backed by Madhusudan Kela reports ₹10 Cr loss against profit of ₹70 Cr last year
Synopsis: A Madhusudan Kela-backed small-cap stock fell nearly 5% after reportin...

Pharma stock to buy now for an upside of up to 25%; Recommended by Jefferies and HSBC
Synopsis: Brokerages remain constructive on Divi’s Laboratories despite near-ter...

Kwality Pharma shares hit 20% upper circuit on strong PAT growth; revenue breakdown explained
Synopsis: Pharma stock surged 20 percent to Rs 1,377 after Q3 FY26 results, with...