Dogecoin (DOGE) Stalls in Range, Bulls Fail to Seize Momentum
Alex Smith
3 hours ago
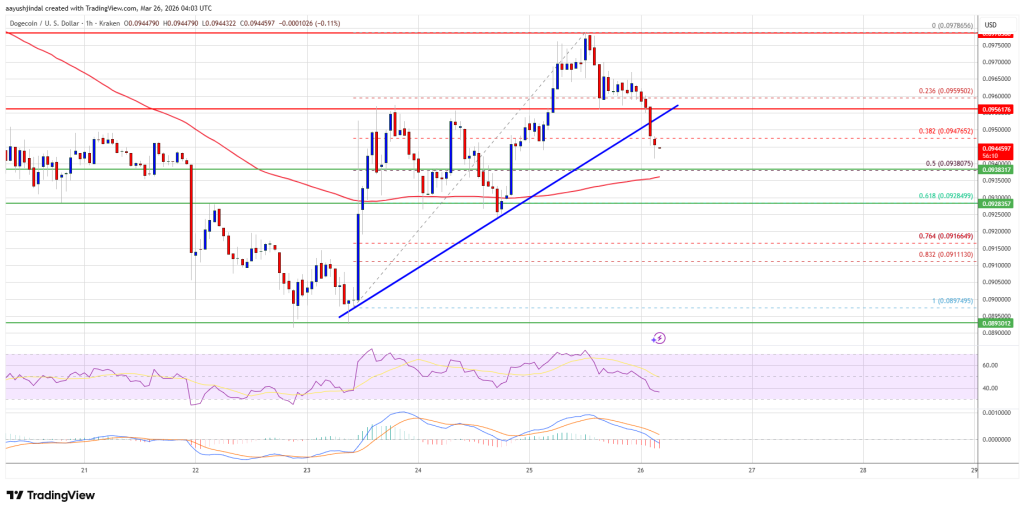
Dogecoin corrected some gains from the $0.0980 zone against the US Dollar. DOGE is now holding the $0.0940 support and might aim for a fresh increase.
- DOGE price started a fresh downside correction below $0.0955.
- The price is trading above the $0.0940 level and the 100-hourly simple moving average.
- There was a break below a bullish trend line with support at $0.0952 on the hourly chart of the DOGE/USD pair (data source from Kraken).
- The price could aim for a fresh increase if it remains stable above $0.0928.
Dogecoin Price Trims Gains
Dogecoin price started a downside correction after it failed to surpass $0.0980, like Bitcoin and Ethereum. DOGE declined below the $0.0960 and $0.0955 levels.
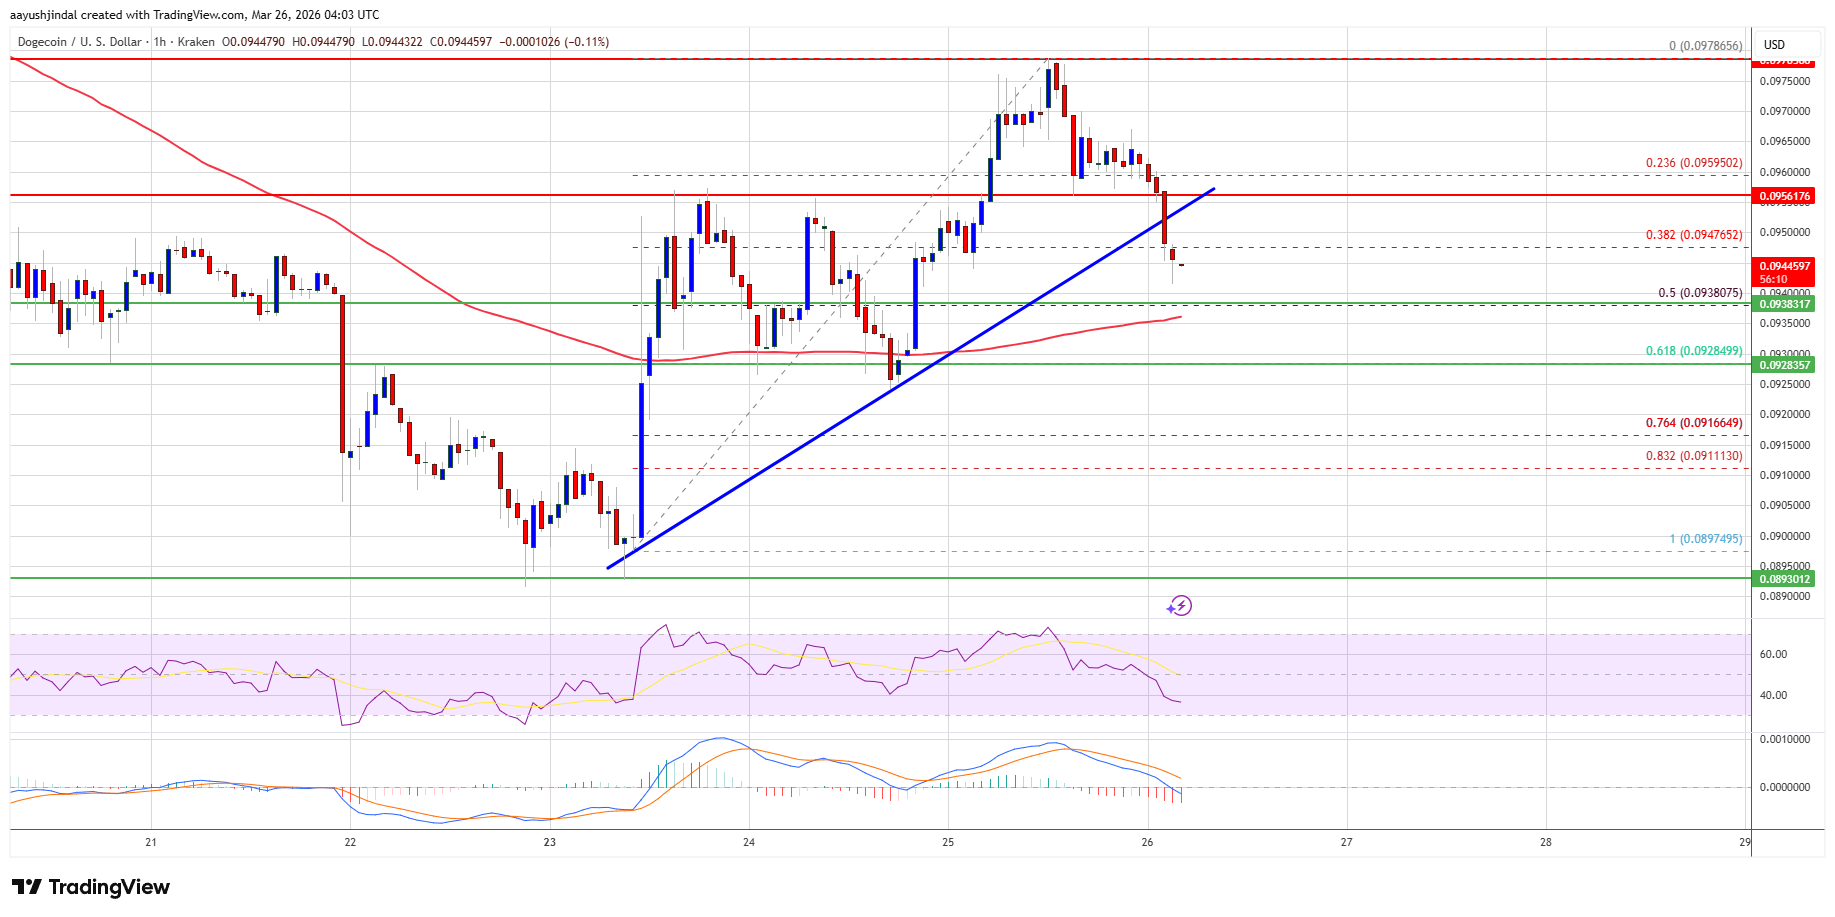
There was a move below the 38.2% Fib retracement level of the upward move from the $0.0897 swing low to the $0.0978 high. Besides, there was a break below a bullish trend line with support at $0.0952 on the hourly chart of the DOGE/USD pair.
The price even spiked below $0.0950 before the bulls appeared. Dogecoin price is now trading above the $0.0940 level and the 100-hourly simple moving average. Immediate resistance on the upside is near the $0.0955 level.
The first major resistance for the bulls could be near the $0.0980 level. The next major resistance is near the $0.10 level. A close above the $0.10 resistance might send the price toward $0.1080. Any more gains might send the price toward $0.1120. The next major stop for the bulls might be $0.120.
More Losses In DOGE?
If DOGE’s price fails to climb above the $0.0980 level, it could continue to move down. Initial support on the downside is near the $0.0940 level or the 50% Fib retracement level of the upward move from the $0.0897 swing low to the $0.0978 high.
The next major support is near the $0.09280 level. The main support sits at $0.0880. If there is a downside break below the $0.0880 support, the price could decline further. In the stated case, the price might slide toward the $0.0840 level. Any more losses might call for a test of $0.080.
Technical Indicators
Hourly MACD – The MACD for DOGE/USD is now losing momentum in the bullish zone.
Hourly RSI (Relative Strength Index) – The RSI for DOGE/USD is now below the 50 level.
Major Support Levels – $0.0940 and $0.0928.
Major Resistance Levels – $0.0955 and $0.0980.
Related Articles

None Of The 30 Bitcoin Market Peak Indicators Have Been Hit, So Why Did The Price Crash?
The Bitcoin price topped slightly above $126,000 back in October 2026 and is now...

Bitcoin Whales Go Silent: Large Transactions Plummet
On-chain data shows the Bitcoin Whale Transaction Count has witnessed a drawdown...
Ethereum (ETH) May Be Reversing Course, Says Top Analyst; Watch These Key Resistances
The market’s second-largest cryptocurrency, Ethereum (ETH), surged nearly 3% on...
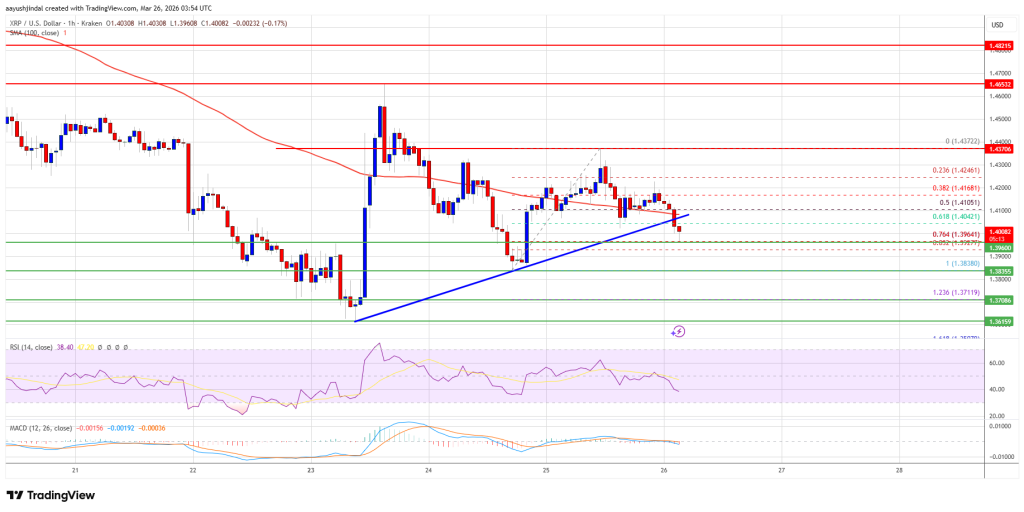
XRP Price Risks Fresh Drop, Is Another Leg Lower Imminent?
XRP price started a fresh decline from $1.4380. The price is now struggling and...