Dogecoin Eyes 300% Upside As Analyst Flags Major Reversal Zone
Alex Smith
3 hours ago
Dogecoin is back at a technical level that historically favored accumulation, with the memecoin testing long-term support as weekly momentum cools. The setup, laid out by Cryptoinsightuk’s Will Taylor, points to a potential 300% move if DOGE can once again trade the upper end of its multi-year range.
Will The Dogecoin Price Explode By 300%?
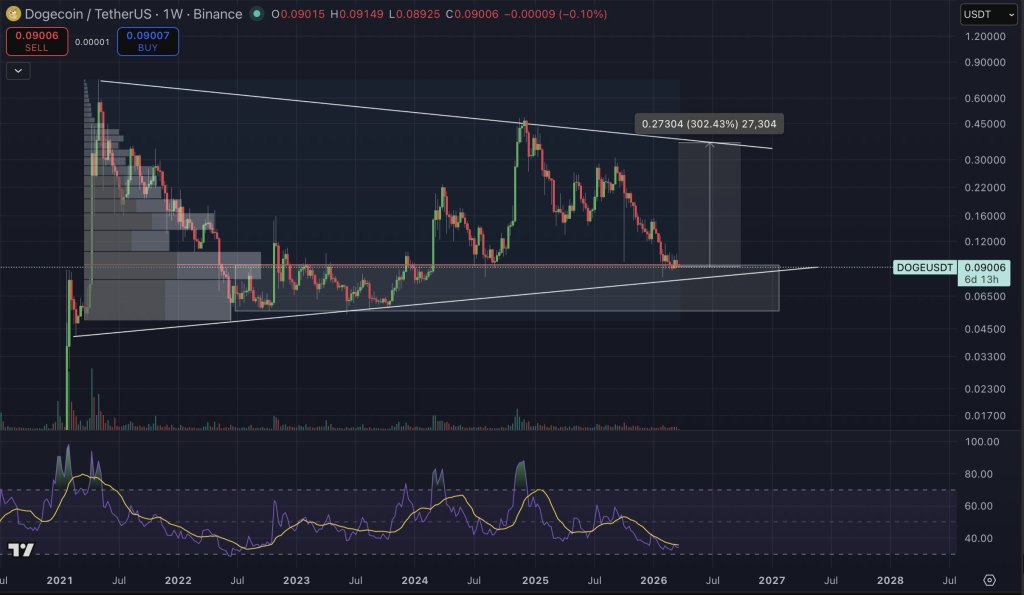
Taylor’s thesis is built almost entirely on structure. On the weekly DOGE/USDT chart he shared, Dogecoin was sitting near $0.09006, pressed into the lower boundary of a broad pennant formation that has contained price action for years. The same chart marked a projected move to roughly $0.27304, labeled as a 302.43% upside swing from current levels.
“DOGE is technically at such an interesting level again,” Taylor wrote on X. “Weekly RSI looks compressed as downside momentum slows. We are revisiting a previous area of accumulation / support AND at the bottom of a wider range (Bull Pennant). We are also at the area of most trading volume, can often be a reversal area.”
That combination is the core of the bullish case. In Taylor’s view, Dogecoin is not just drifting into support in price terms; it is also returning to the heaviest historical trading zone on the volume profile, a region where buyers and sellers previously did the most business.
For technical traders, that kind of confluence matters. A prior accumulation band, a long-term rising support line and a high-volume node clustered in the same area can strengthen the argument that downside is becoming less efficient.
The weekly RSI reading is also central to his call. Taylor did not attach a numeric target for the indicator, but the chart shows RSI compressed near the lower end of its recent range, with the momentum curve flattening after a long decline. His reading is that selling pressure is slowing rather than accelerating, which makes the current zone more interesting for spot accumulation than for momentum shorts.
“If you accumulate and only play the range itself you’re looking at 300% to the upside,” he said. “The technical argument would be it breaks out positively too. I am going to have a few stabs at doge here I think. Great for a spot buy technically though imo.”
Taylor also posted a DOGE/gold chart via X. On that weekly pair, Dogecoin appears to be revisiting a marked support zone after a long drawdown, while RSI again looks subdued and close to oversold territory. Relative-strength charts like DOGE/gold do not guarantee a reversal in USD terms, but they can reinforce the idea that the asset is approaching an area where its underperformance may be getting stretched.
At press time, DOGE traded at $0.09346.
Related Articles
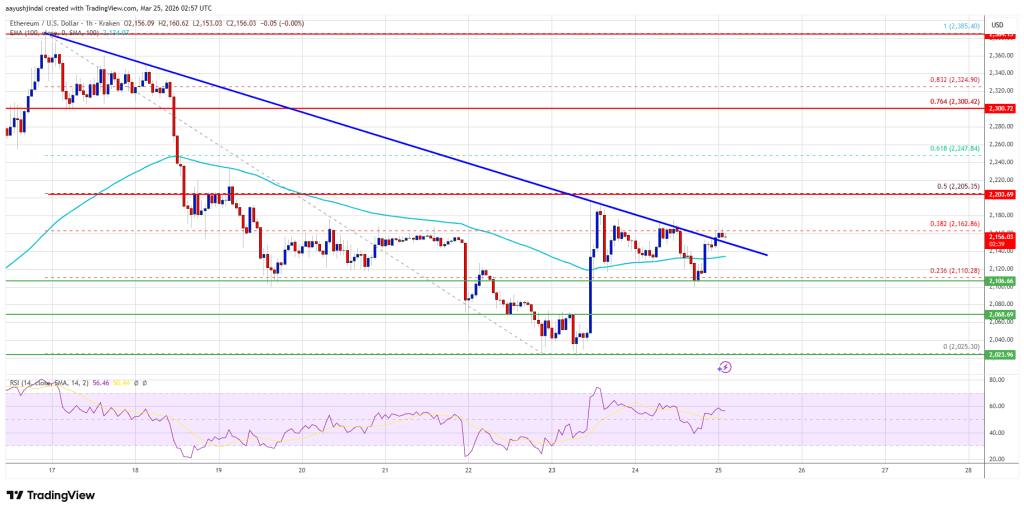
Ethereum Price Trends Higher, Bulls Look to Extend Gains Further
Ethereum price started a recovery wave above the $2,065 zone. ETH is now consoli...

XRP Eyes Massive Breakout, But Not Before A Potential Shakeout
XRP is showing strong signs of a larger breakout on the horizon, but the path hi...
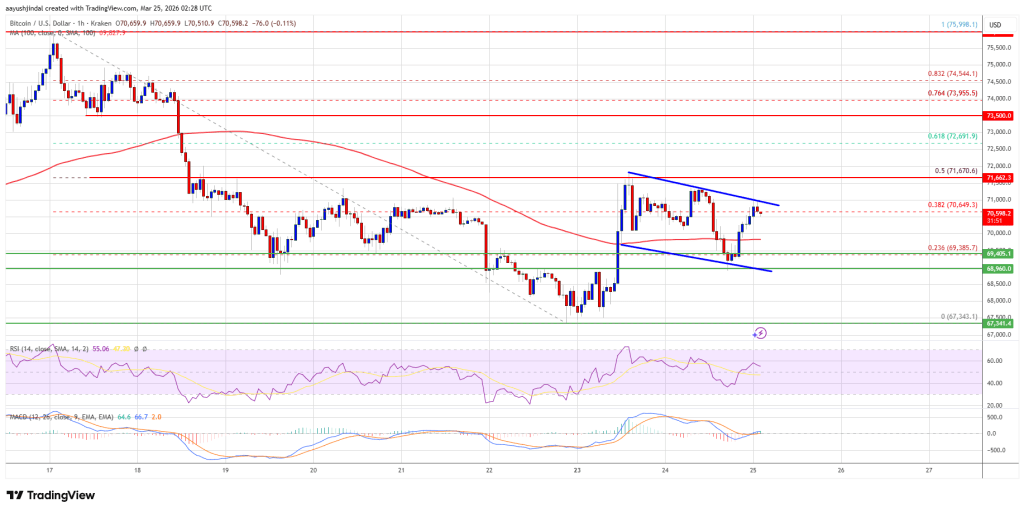
Bitcoin Price Approaches Break Zone, Upside Move Looks Likely
Bitcoin price started a recovery wave above $69,200. BTC is now back above $70,0...
Bitcoin, XRP Rallies Won’t Hold Until Oil Falls Toward $80, Expert Warns
Brent crude slid nearly 12% on Monday to trade around $94, but market expert Sam...