Dr Reddy’s stock forms bearish engulfing pattern; Check the support and resistance
Alex Smith
5 hours ago

Synopsis: Dr Reddy’s Laboratories Ltd formed a bearish engulfing pattern on the 4-hour chart, signalling a potential near-term bearish reversal.
The Bearish Engulfing pattern signals a momentum reversal, as sellers overpower buyers after strength, indicating rising selling pressure and supporting bearish potential.
A bearish engulfing pattern signals a potential reversal after recent strength. The strong bearish candle engulfing the prior bullish one reflects a shift in sentiment.
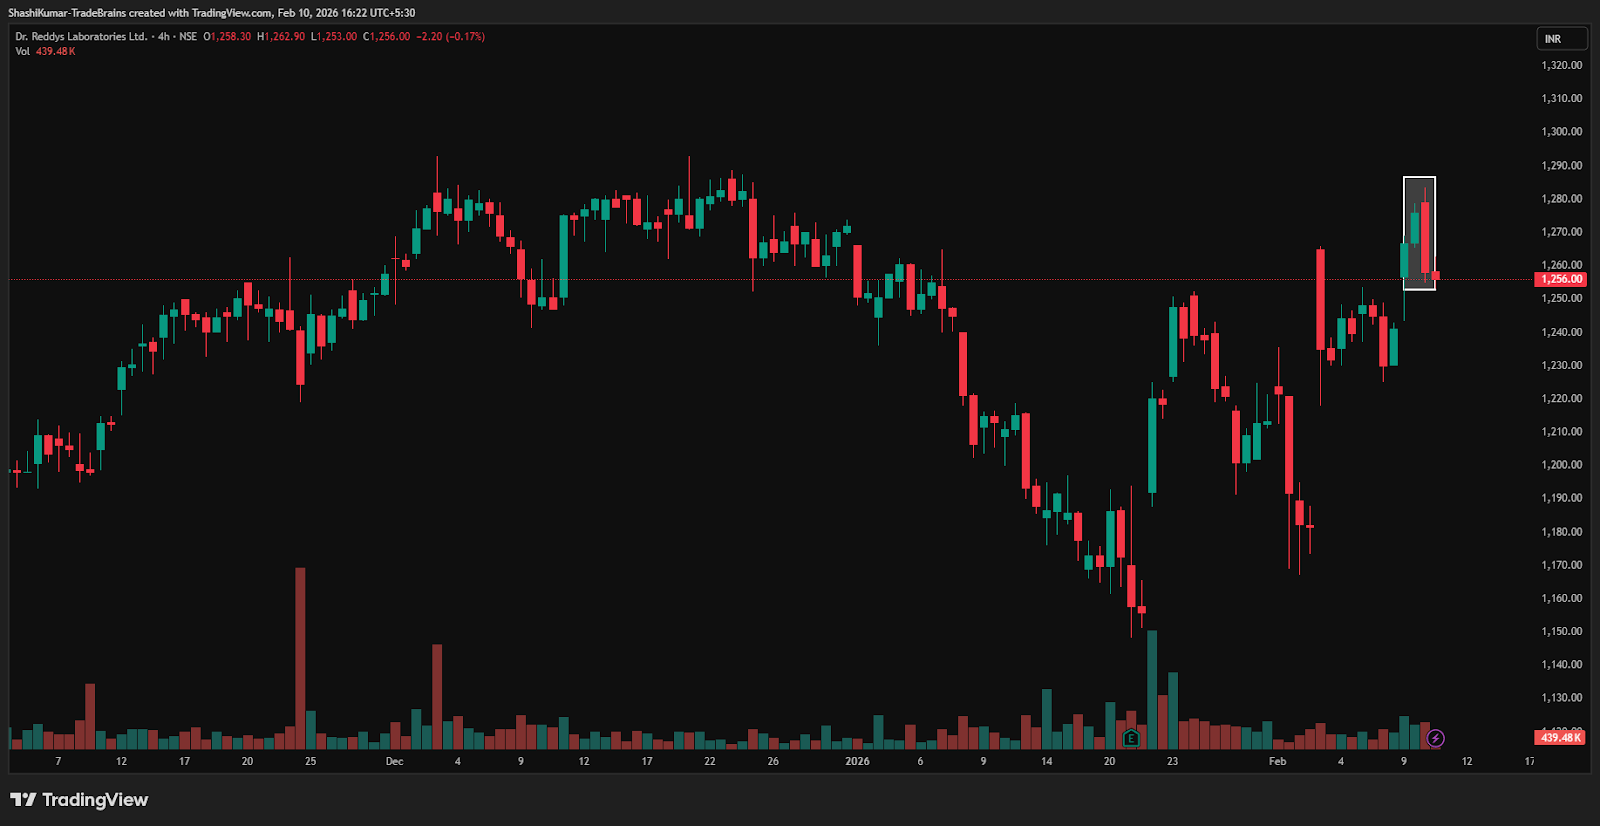
On Tuesday, Dr Reddy’s Laboratories Ltd formed a bearish engulfing pattern on the 4-hour timeframe near the Rs 1,258 level. The strong red candle signalled increased selling pressure. A sustained move below Rs 1,258 could open the door for further downside, while a recovery above this level would weaken the bearish outlook.
The targets are typically set near the nearest support levels below the reversal. Traders may trail profits as price declines, booking partial or full gains around key support zones, while monitoring follow-through weakness and volume for confirmation or early signs of selling exhaustion.
Dr Reddy’s Laboratories Ltd: : 4-hour Timeframe
Indicator Confirmation
RSI: The daily RSI indicates bearish momentum, as it fell from 62 in the previous trading session to 56.5 on Tuesday, confirming the bearish reversal.
Price Volume Trend: The Price Volume Indicator confirms the downtrend, accompanied by a sharp decrease in buying volume in the daily time frame.
Implications
The formation of a bearish engulfing pattern points to potential downside for the stock. A sustained move below the key Rs 1,258 level, preferably on strong selling volumes, would confirm the reversal and reduce the risk of a false signal. Remaining below this level would reinforce near-term bearish momentum.
About the stock
Dr Reddy’s Laboratories Ltd is a global pharmaceutical company headquartered in Hyderabad, India. Established in 1984, it focuses on affordable and innovative medicines across APIs, generics, biosimilars, and OTC products, with key markets in the USA, India, Europe, and emerging economies.
Over the past month, Dr Reddy’s Laboratories Ltd has gained 3.31%. The stock is up 2.97% over the last six months and has risen 2.85% compared to the same period last year.
For more such technical stock ideas, click here to view our research page.
Disclaimer: The views and investment tips expressed by investment experts/broking houses/rating agencies on tradebrains.in are their own, and not that of the website or its management. Investing in equities poses a risk of financial losses. Investors must therefore exercise due caution while investing or trading in stocks. Trade Brains Technologies Private Limited or the author are not liable for any losses caused as a result of the decision based on this article. Please consult your investment advisor before investing.
The post Dr Reddy’s stock forms bearish engulfing pattern; Check the support and resistance appeared first on Trade Brains.
Related Articles

NBFC stock jumps 19% after reporting 744% revenue growth in Q3
Synopsis: An NBFC stock surged nearly 19% after reporting a sharp 744% YoY jump...

Tata Group: Tata Steel and 6 other stocks with over 100% net profit growth in Q3 to look out for
Synopsis: Automobile Corporation of Goa, Automotive Stampings, Tata Investment,...

Vodafone Idea: Can the ₹45,000 Cr Capex Plan Save the Telecom Giant?
Synopsis: Vodafone Idea is making a significant effort to bounce back after faci...

M&M, Divi’s Labs, Ashok Leyland and 7 Other Stocks to Announce Q3 Results Today
Synopsis: M&M, Divis Labs, Ashok Leyland, and seven other companies announce...