Eternal Ltd Forms A Rectangular Channel Pattern Indicating A Bullish Breakout
Alex Smith
3 hours ago

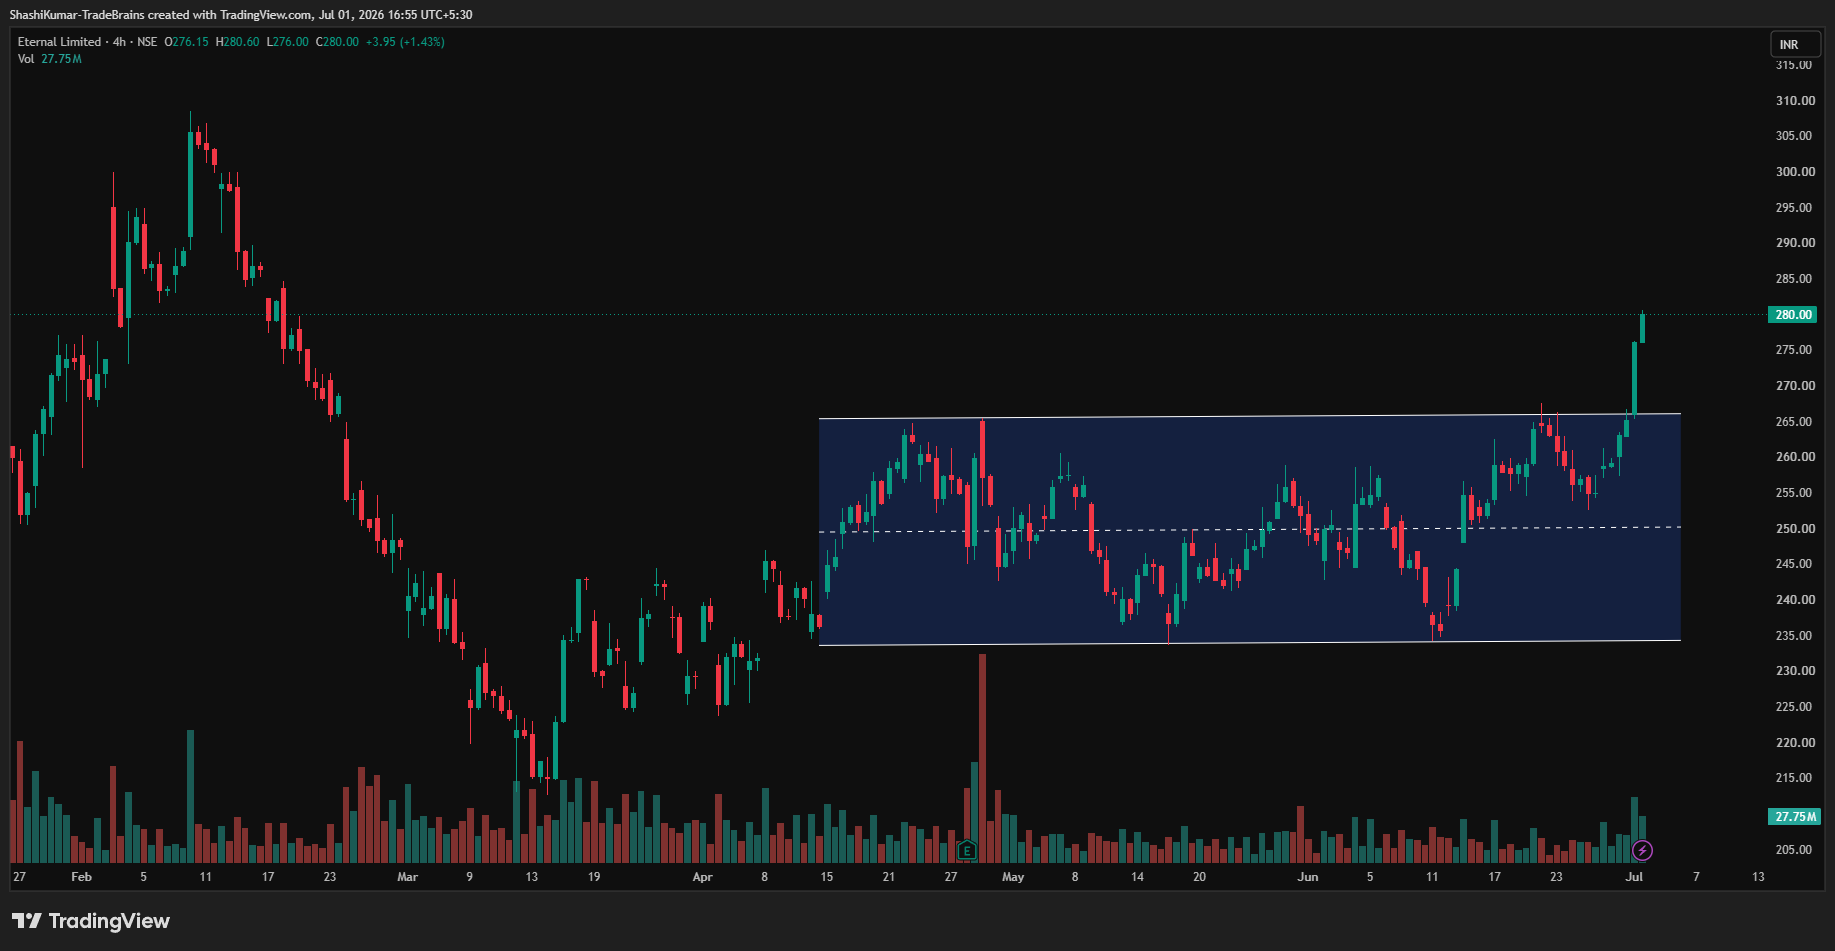
Synopsis: Eternal Ltd has formed a rectangular channel on the 4-hour chart, and an upside breakout indicates a bullish bias.
The Eternal Ltd, following a phase of sideways consolidation in recent sessions, has developed a rectangular channel pattern. From the above chart, the stock has clearly broken above the key resistance level near Rs 265.
On Wednesday, the stock reached a higher high and broke above the key resistance level of Rs 265 and ended the session at Rs 280 in 4-hour chart time frame The move was backed by a sharp rise in volumes, signalling the emergence of near-term bullish momentum.
For a rectangular channel, the price target is estimated by adding the height of the prior range to the breakout level or by identifying the next resistance zones. Traders use this projection to set profit targets and often book partial or full gains as prices near these levels.
Eternal Ltd Chart: 4-hour Timeframe
Indicator Confirmation
- RSI: The daily RSI indicates bullish momentum, as it rose from 60.47 in the previous trading session to 69.32, which is almost entering the overbought zone.
- MACD: On the daily time frame, the blue MACD line was above the orange signal line, with the histogram turning green, indicating bullish momentum.
- Moving Averages: On the daily time frame, the 5-day EMA was above the 9-day EMA, further confirming a bullish trend.
- Price Volume Trend: The Price Volume Indicator confirmed the uptrend, supported by a sharp increase in buying volumes in the daily timeframe.
- On-Balance Volume: The rising OBV and rising price confirm that the trend is a strong, sustainable upward trend driven by high buying pressure.
Implications
A breakout from the rectangular channel signals possible upside. Sustained closes above Rs 265 with rising buying interest would confirm strength and reduce the risk of a false breakout. This level, now acting as support, is key to maintaining near-term bullish momentum.
About the stock
Eternal Limited (formerly known as Zomato Limited) is an Indian public limited company that operates prominent digital e-commerce platforms. The company manages four key business segments: online food ordering and delivery (Zomato), quick commerce marketplace delivery (Blinkit), going-out ticketing and discovery experiences (District), and B2B restaurant supplies (Hyperpure).
Over the past year, Eternal Ltd delivered a 7.28% return, driven largely by a 12.86% surge in the last month, which managed to offset a marginal 1.34% decline over the six-month period. For more such technical stock ideas, Click hereto view our research page.
Disclaimer: The views and investment tips expressed by investment experts/broking houses/rating agencies on tradebrains.in are their own, and not that of the website or its management. Investing in equities poses a risk of financial losses. Investors must therefore exercise due caution while investing or trading in stocks. Trade Brains Technologies Private Limited or the author are not liable for any losses caused as a result of the decision based on this article. Please consult your investment advisor before investing.
The post Eternal Ltd Forms A Rectangular Channel Pattern Indicating A Bullish Breakout appeared first on Trade Brains.
Related Articles

Maruti vs M&M vs Tata Motors: Which Auto Stock Is a Better Buy for Long-Term Growth?
Synopsis: Leading brokerage houses have revised their outlook on India’s p...

4 Small-Cap EMS Stocks With Strong Financials to Keep an Eye On
Synopsis: India’s EMS sector is supported by localisation, semiconductor growth...

Stock to Buy: Chemical Stock With 55% Upside Potential
Synopsis: HSBC maintained its Buy rating on UPL with a Rs. 880 target, citing im...

Debt Free Small-Cap Stock Has Delivered a 68% Profit CAGR in 3 Yrs; Can FY27 Be Even Better?
Synopsis: A small fintech player just posted a year of mixed signals – soa...