Ethereum Takes a Blow, Though Buyers Continue Shielding Key Price Floors
Alex Smith
2 months ago
Ethereum price started a fresh decline below $2,880. ETH is now attempting to recover from $2,720 but the bulls might face resistance.
- Ethereum started a fresh decline below $2,880 and $2,800.
- The price is trading below $2,850 and the 100-hourly Simple Moving Average.
- There is a short-term bearish trend line forming with resistance at $2,820 on the hourly chart of ETH/USD (data feed via Kraken).
- The pair could continue to move up if it settles above the $2,850 zone.
Ethereum Price Attempts Recovery
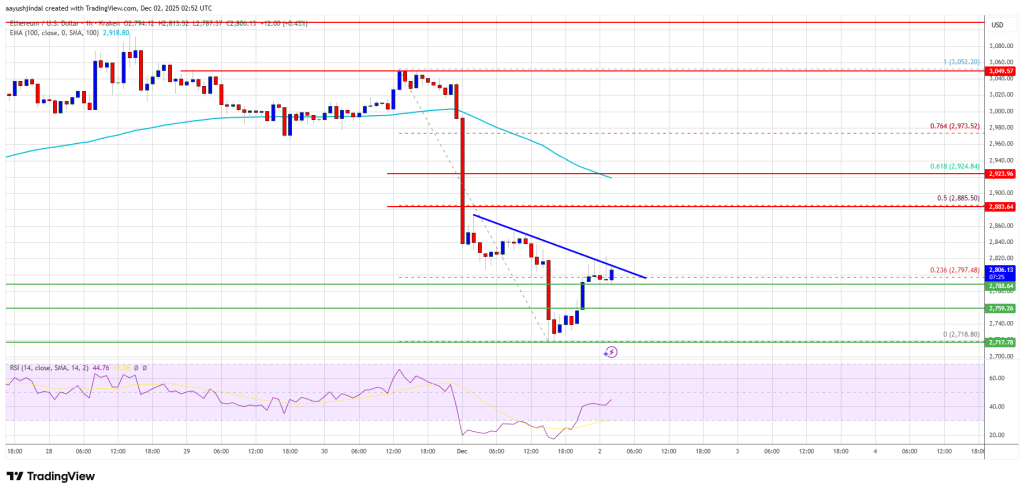
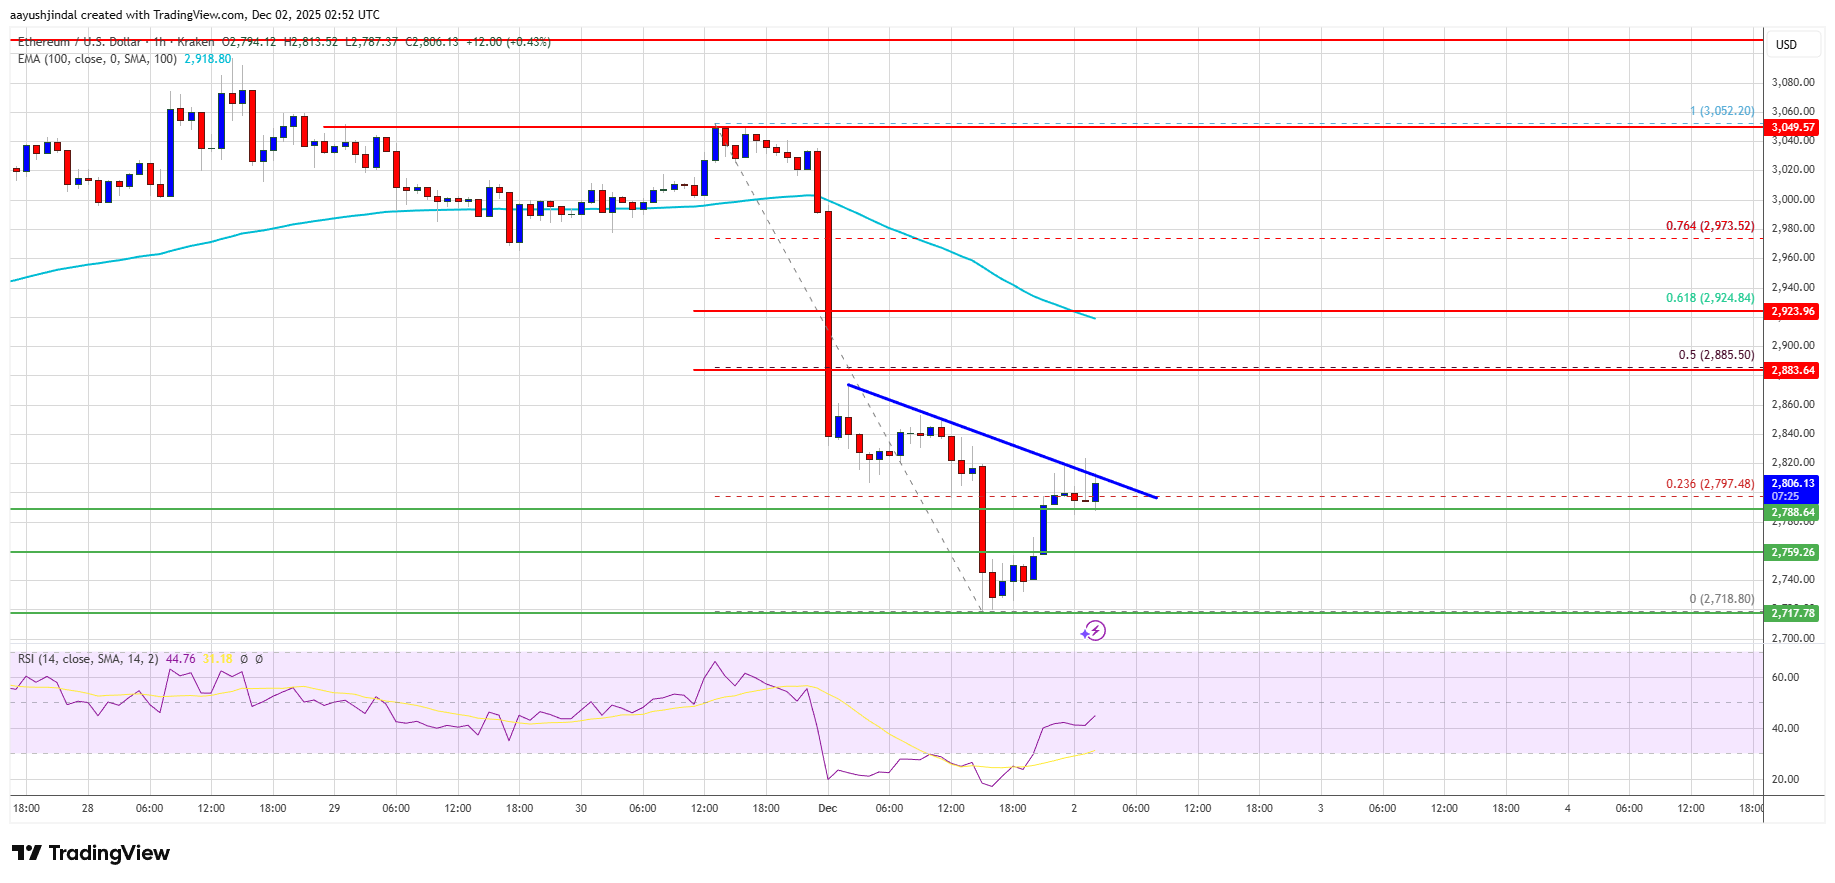
Ethereum price failed to stay above $2,950 and started a fresh decline, like Bitcoin. ETH price declined below $2,880 to enter a bearish zone. The bears even pushed the price below $2,800.
A low was formed at $2,718 and the price is now attempting to recover. There was a move above the $2,750 level. The price climbed above the 23.6% Fib retracement level of the downward move from the $3,052 swing high to the $2,718 low.
Ethereum price is now trading below $2,850 and the 100-hourly Simple Moving Average. If there is another upward move, the price could face resistance near the $2,820 level. There is also a short-term bearish trend line forming with resistance at $2,820 on the hourly chart of ETH/USD.
The next key resistance is near the $2,880 level or the 50% Fib retracement level of the downward move from the $3,052 swing high to the $2,718 low. The first major resistance is near the $2,920 level. A clear move above the $2,920 resistance might send the price toward the $3,000 resistance. An upside break above the $3,000 region might call for more gains in the coming days. In the stated case, Ether could rise toward the $3,050 resistance zone or even $3,150 in the near term.
Another Decline In ETH?
If Ethereum fails to clear the $2,880 resistance, it could start a fresh decline. Initial support on the downside is near the $2,760 level. The first major support sits near the $2,740 zone.
A clear move below the $2,740 support might push the price toward the $2,720 support. Any more losses might send the price toward the $2,650 region in the near term. The next key support sits at $2,550 and $2,500.
Technical Indicators
Hourly MACD – The MACD for ETH/USD is losing momentum in the bearish zone.
Hourly RSI – The RSI for ETH/USD is now below the 50 zone.
Major Support Level – $2,720
Major Resistance Level – $2,880
Related Articles
These Three Catalysts Could Spark Bitcoin’s Next Rally, According To Wintermute
Crypto market maker Wintermute published a detailed market update on Tuesday via...

Goldman Sachs Adjusts Bitcoin ETF Holdings as New Security Narratives Emerge
What to Know: Institutional players like Goldman Sachs are actively managing the...

Bitcoin, Ethereum, and Ripple Stall at Key Resistance as a Hyper Captures Market Focus
What to Know: Major cryptocurrencies like Bitcoin, Ethereum, and XRP are facing...
Jim Cramer Suggests US Government Could Buy Bitcoin Near $60K
A prominent market commentator’s offhand remark has set off fresh talk in crypto...