Hindustan Copper Shows Near-term Bearishness; Check the chart and details
Alex Smith
3 weeks ago

Synopsis: Hindustan Copper Ltd has displayed a bearish reversal pattern on the 30-minute chart, indicating emerging near-term bearish momentum.
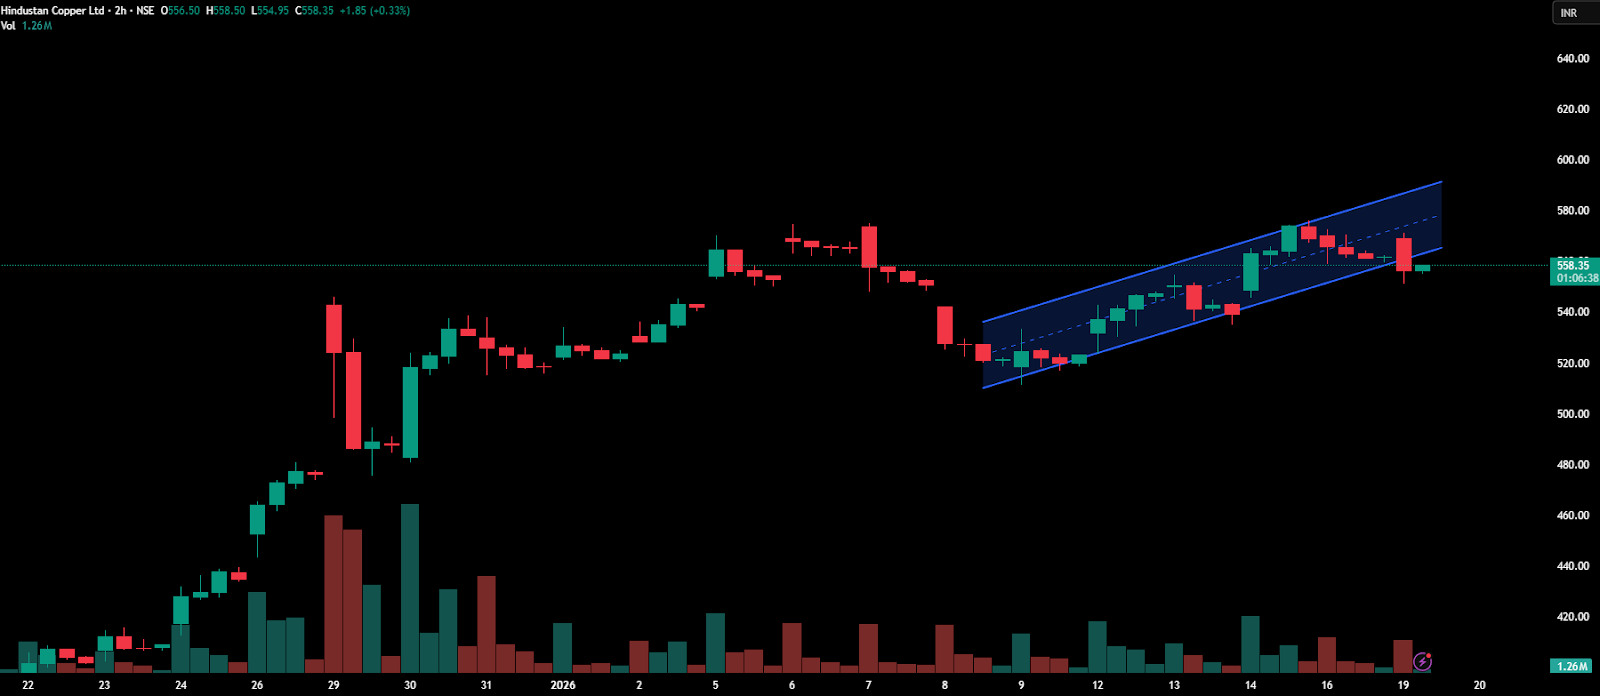
Hindustan Copper Ltd, after a phase of steady gains in recent sessions, formed an ascending channel on its 30-minute chart. A breakdown below the channel signals a potential bearish reversal.
(30-min Timeframe)The ascending channel pattern reflects a short-term uptrend, with prices oscillating between parallel upward-sloping support and resistance. A decisive breakdown below the lower boundary signals a potential bearish reversal, suggesting sellers are gaining control and downside momentum could accelerate.
On Monday, the stock formed a higher low within the ascending channel but slipped below the key support zone of Rs 570. The move, accompanied by rising selling pressure, indicates emerging near-term bearish momentum. Sustained trading below this level could increase downside risk and signal a potential breakdown from the channel.
In an ascending channel breakdown, downside targets are typically identified using immediate support levels below the breakdown point. Traders often use these zones to book partial or full profits, while closely monitoring price action for signs of further weakness or a potential reversal.
Indicator Confirmation
- RSI: The daily RSI indicates a bearish reversal, as it decreased from 70 in the previous trading session to 65 on Monday, confirming the downtrend.
- MACD: The Blue MACD line crossed below the orange signal line, with the histogram turning red, indicating bearish momentum.
- Moving Averages: On the 30-min time frame, the 5-day moving average has crossed below the 9-day moving average, further confirming a bearish trend.
- Price Volume Trend: The Price Volume Indicator confirmed the downtrend, supported by a decline in buying volumes.
Implications
The breakdown from the ascending channel suggests scope for further downside. A sustained close below the key Rs 570 support, ideally accompanied by higher selling volume, would confirm the breakdown and reduce the risk of a false signal. The former support near Rs 570 has now turned into immediate resistance, and continued trading below this level would strengthen bearish control in the near term.
About the stock
Hindustan Copper Limited (HCL), incorporated in 1967, is India’s sole vertically integrated copper producer, handling mining, beneficiation, smelting, refining, and casting of copper products. A Miniratna Category-I public sector enterprise under the Ministry of Mines, it owns all operating copper ore mining leases in India and accesses about 45% of the nation’s copper reserves.
Over the past month, Hindustan Copper Ltd has rallied 33.75%, reflecting a sustained uptrend. The stock has gained 97.11% over the last six months and is up 114.81% on a year-on-year basis. For more such technical stock ideas, click here to view our research page.
Disclaimer: The views and investment tips expressed by investment experts/broking houses/rating agencies on tradebrains.in are their own, and not that of the website or its management. Investing in equities poses a risk of financial losses. Investors must therefore exercise due caution while investing or trading in stocks. Trade Brains Technologies Private Limited or the author are not liable for any losses caused as a result of the decision based on this article. Please consult your investment advisor before investing.
The post Hindustan Copper Shows Near-term Bearishness; Check the chart and details appeared first on Trade Brains.
Related Articles

Solar Industries, Caplin Point and 6 other stocks delivering back-to-back EPS growth
Synopsis: Stocks like Solar Industries, Waaree Energies, and Navin Fluorine and...

Will Max Financial share price cross ₹2,000 after announcing robust Q3 results?
Synopsis: Max Financial gains after robust Q3 performance; Jefferies reiterates...

Angel One Vs Groww: Which stockbroker performed better in Q3?
Synopsis: Angel One and Groww delivered contrasting performances in Q3 FY26. Ang...

₹80,900 Cr Valuation: Why is Lenskart considered a tech company despite being a retail brand?
Synopsis: Lenskart is called a tech company because it uses advanced data and ar...