Hitachi Energy India Forms An Ascending Triangle Pattern Signalling A Near-Term Bullish Breakout
Alex Smith
1 hour ago

Synopsis: Hitachi Energy India Ltd. has formed an ascending triangle on the 4-hour chart, signaling a possible short-term bullish breakout.
An ascending triangle is a bullish reversal pattern marked by higher lows and a flat resistance line. The chart shows a confirmed bullish breakout above the resistance neckline. Supported by volume surge and points to a potential short-term upward move.
On Wednesday, Hitachi Energy India Ltd. broke the resistance neckline and sustained above the Rs 32,920 level, which is now acting as a support zone in the 4-hour chart, reinforcing its bullish momentum.
In an ascending triangle, traders typically target the nearest resistance level or project a price move equal to the triangle’s height from the breakout point, using strong volume and momentum to confirm the trade.
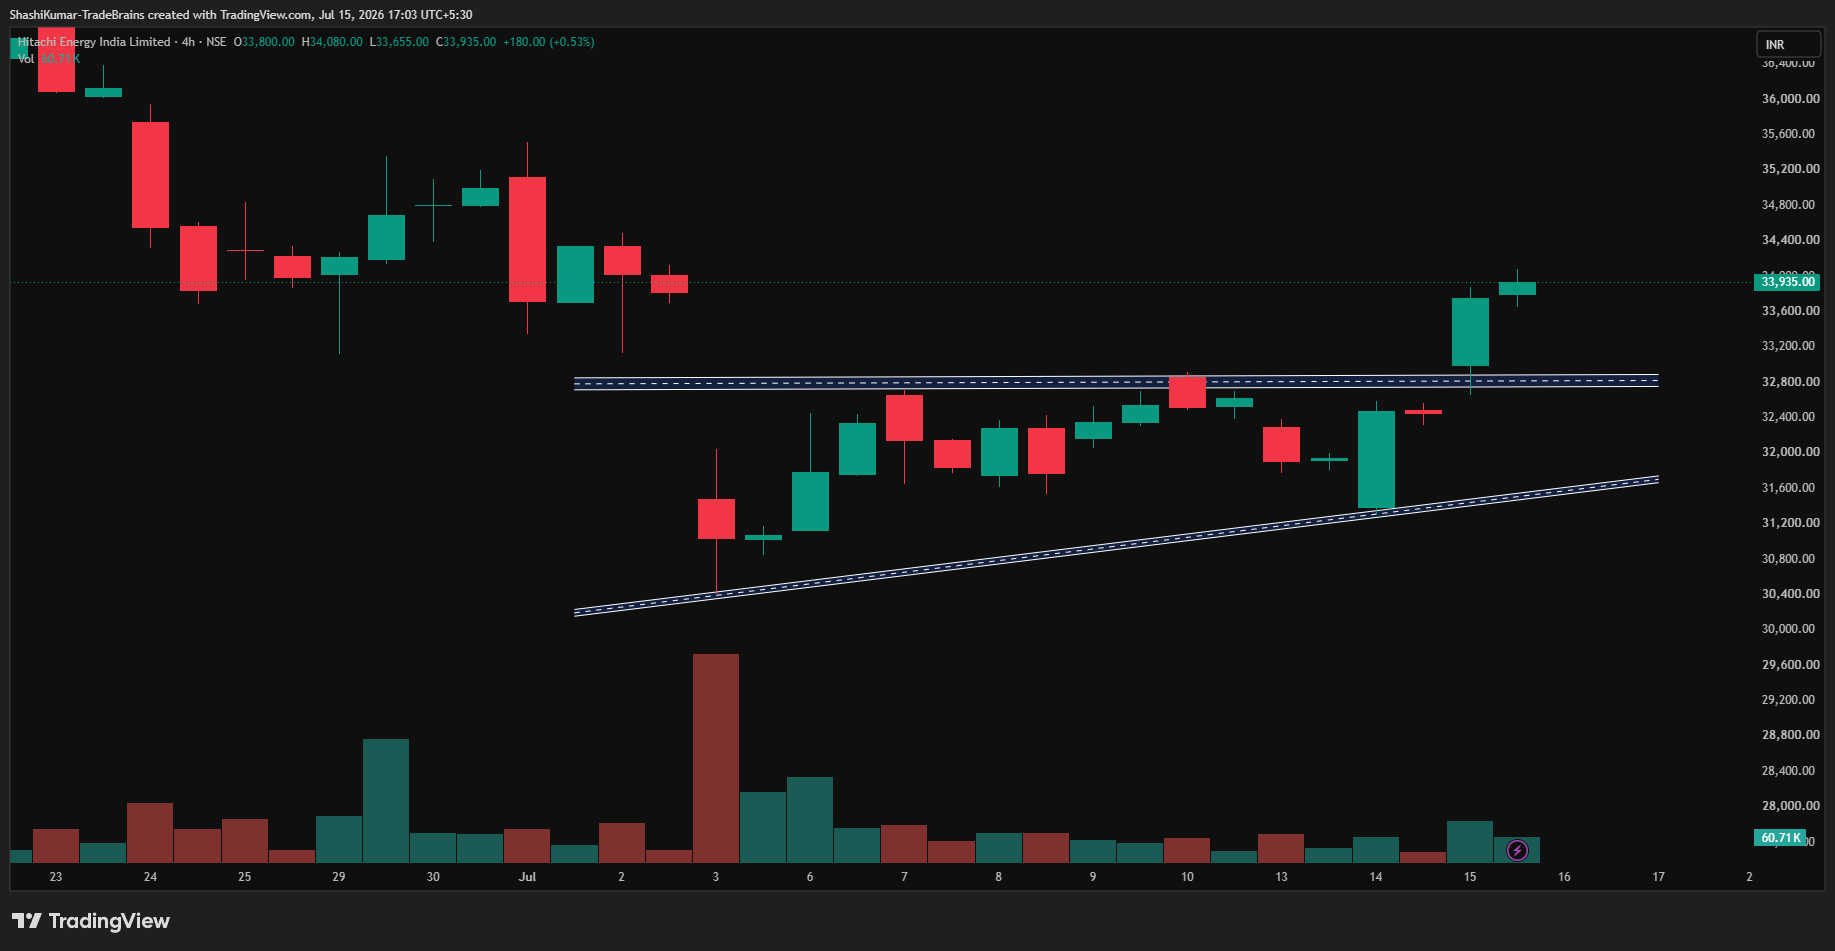
Hitachi Energy India Ltd Chart: 4-hour Timeframe
Indicator Confirmation
- RSI: The daily RSI indicates buying pressure, as it rose from 44.36 in the previous trading session to 51.95 on Wednesday.
- Price Volume Trend: The Price Volume Indicator confirms the uptrend, accompanied by an increase in buying volume in the daily time frame.
- Moving Averages: On the daily time frame, the 5-day EMA was above the 9-day EMA, further confirming a bullish trend.
Implications
The ascending triangle pattern in a short-term downtrend indicates bullish reversal. Maintaining levels above the Rs 32,920 support mark, especially with strong trading volumes, would further strengthen the near-term bullish outlook.
About the stock
Hitachi Energy is a global leader in electrification, powering the electricity era to meet the energy demands of today and the next 25 years. As the energy arm of Hitachi Group, over three billion people depend on pioneering, mission-critical technologies to power their daily lives.
Over the past month, Hitachi Energy India Ltd has declined 2.19%. The stock is up 109.29% over the past six months and up an 84.08% increase YoY. For more such technical stock ideas, clickhereto view our research page.
Disclaimer: The views and investment tips expressed by investment experts/broking houses/rating agencies on tradebrains.in are their own, and not that of the website or its management. Investing in equities poses a risk of financial losses. Investors must therefore exercise due caution while investing or trading in stocks. Trade Brains Technologies Private Limited or the author are not liable for any losses caused as a result of the decision based on this article. Please consult your investment advisor before investing.
The post Hitachi Energy India Forms An Ascending Triangle Pattern Signalling A Near-Term Bullish Breakout appeared first on Trade Brains.
Related Articles

Stocks to Watch: BHEL, Wipro, and 8 Other Top Companies Announcing Q1 Results Today
Synopsis: ITC Hotels, Jio Financial, Tech Mahindra, Polycab, Wipro, South Indian...

Pidilite Shares Receive ‘Buy’ Rating from HSBC; Check the Upside
Synopsis: HSBC has started coverage on Pidilite with a positive view, citing its...

Will Havells India’s Entry Into the BESS Segment Power Its Next Growth Phase?
Synopsis:The share of this company could benefit from its entry into the Battery...

2 Jewellery Stocks That Delivered Returns of Up to 85% in Q1 FY27; Are They Still Worth Watching?
Synopsis: A handful of jewellery counters have quietly turned into multibaggers...