Kalshi Hits Record $3.4B Week, Polymarket Sports Surge as March Madness Heats Up
Alex Smith
4 hours ago
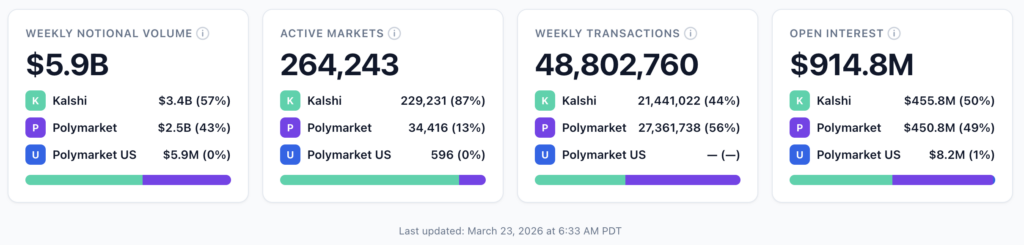
The numbers prediction market watchers had been anticipating since Selection Sunday finally arrived last week. Prediction market industry notional volume hit $6.41 billion for the week of March 16–22, a new all-time high in the DeFi Rate tracking period, driven by back-to-back record weeks from Kalshi and a meaningful surge from Polymarket as Round 1 of the NCAA Tournament tipped off Thursday. The prior combined record, set two weeks earlier, was $5.89 billion.
Kalshi posted $3.40 billion in notional volume, breaking its own single-week record of $2.93 billion set the week prior. Polymarket added $2.54 billion, up 8.5% week-over-week. Together the two platforms generated $5.94 billion, the highest combined weekly total on record. What makes this week different from prior records is that both platforms grew simultaneously, in lockstep with the sports calendar (week one of March Madness).
As our live prediction markets tracker shows, active markets exploded week over week from 309,969 to 455,631 (+145,662 / +47.0%), almost entirely from Kalshi building out its March Madness markets, moving from 274,857 to 419,953 (+145,096).
Kalshi pulling away from Polymarket on sports volume
Kalshi held 57.2% market share on a head-to-head basis, up from 55.6% the prior week. The gap is widest during major sports events, and this week was as sports-heavy as any week outside the Super Bowl.
Kalshi vs. Polymarket: Volume and transactions last 6 weeks
Kalshi_Vol_M Polymarket_Vol_M Kalshi_Tx_M Polymarket_Tx_M (function() { function _ptmInit() { var el = document.getElementById('ptm-chart-1'); if (!el) return; var ctx = el.getContext('2d'); new Chart(ctx, { type: 'bar', data: { labels: ["Feb 9","Feb 16","Feb 23","Mar 2","Mar 9","Mar 16"], datasets: [{"type":"bar","label":"Kalshi_Vol_M","data":[2428.2,2592,2729.4,2860,2934.75,3396.27],"backgroundColor":"#00d4aa","borderRadius":4,"borderSkipped":false,"maxBarThickness":44,"yAxisID":"yLeft","order":2},{"type":"bar","label":"Polymarket_Vol_M","data":[1879.6,1820,2400.2,2500,2344.27,2544.66],"backgroundColor":"#7c3aed","borderRadius":4,"borderSkipped":false,"maxBarThickness":44,"yAxisID":"yLeft","order":2},{"type":"line","label":"Kalshi_Tx_M","data":[17.4,17.6,18.73,20.04,19.75,21.44],"borderColor":"#f97316","backgroundColor":"transparent","pointRadius":5,"pointHoverRadius":7,"pointBackgroundColor":"#ffffff","pointBorderColor":"#f97316","pointBorderWidth":2.5,"tension":0.35,"borderWidth":2.5,"yAxisID":"yRight","order":1},{"type":"line","label":"Polymarket_Tx_M","data":[19.6,22.7,24.63,26.26,24.67,27.36],"borderColor":"#0ea5e9","backgroundColor":"transparent","pointRadius":5,"pointHoverRadius":7,"pointBackgroundColor":"#ffffff","pointBorderColor":"#0ea5e9","pointBorderWidth":2.5,"tension":0.35,"borderWidth":2.5,"yAxisID":"yRight","order":1}] }, options: { responsive: true, maintainAspectRatio: false, layout: { padding: { top: 8, bottom: 4 } }, interaction: { intersect: false, mode: 'index' }, plugins: { legend: { display: false }, tooltip: { backgroundColor: '#0f172a', titleFont: { family: "'Plus Jakarta Sans', sans-serif", size: 11, weight: 600 }, bodyFont: { family: "'Plus Jakarta Sans', sans-serif", size: 11 }, padding: { x: 10, y: 8 }, cornerRadius: 6, callbacks: { label: function(ctx) { var fmt = ctx.dataset.yAxisID === 'yRight' ? 'compact' : 'number'; return ctx.dataset.label + ': ' + ptmCharts.formatValue(ctx.parsed.y, fmt); } } } }, scales: { x: { grid: { display: false }, ticks: { font: { family: "'Plus Jakarta Sans', sans-serif", size: 11, weight: 500 }, color: '#8a90a0' } }, yLeft: { type: 'linear', position: 'left', beginAtZero: true, grid: { color: 'rgba(0,0,0,0.05)', drawBorder: false }, border: { display: false }, title: { display: false, text: "", color: '#8a90a0', font: { family: "'Plus Jakarta Sans', sans-serif", size: 10, weight: 500 } }, ticks: { font: { family: "'Plus Jakarta Sans', sans-serif", size: 11 }, color: '#8a90a0', padding: 8, callback: function(val) { return ptmCharts.formatValue(val, 'number'); } } }, yRight: { type: 'linear', position: 'right', beginAtZero: true, grid: { drawOnChartArea: false }, border: { display: false }, title: { display: false, text: "", color: '#8a90a0', font: { family: "'Plus Jakarta Sans', sans-serif", size: 10, weight: 500 } }, ticks: { font: { family: "'Plus Jakarta Sans', sans-serif", size: 11 }, color: '#8a90a0', padding: 8, callback: function(val) { return ptmCharts.formatValue(val, 'compact'); } } } } } }); } if (typeof Chart !== 'undefined') { _ptmInit(); } else { document.addEventListener('DOMContentLoaded', _ptmInit); } })();The more interesting metric is open interest, which moved from $870.0M → $952.0M (+$82.0M / +9.4%) based on our tracking. Kalshi drove the bulk of it: $428.8M → $497.0M (+$68.2M), as traders loaded into both individual game contracts and tournament futures with the start of the NCAA basketball tournaments. Polymarket was relatively flat, $440.1M → $447.8M (+$7.7M). Polymarket US jumped from $1.1M to $8.2M, a small absolute number but a 6.5x move, reflecting sports trading ramping up on the US platform, thanks to NCAA tournament betting interest.
Kalshi surges on March Madness, Polymarket stays steady
Kalshi’s sports volume jumped 27.5% week-over-week to $2.67 billion, pushing its sports concentration from 71.3% to 78.6% — the highest share since the NFL playoff weeks in January. The driver is straightforward: the NCAA Tournament is the only event on the sports calendar that consistently rivals Super Bowl week in both market count and per-game trading activity, and this year’s tournament delivered immediately.
Kalshi vs. Polymarket Categories (March 9-15)
PNG Embed CSV Share Kalshi_M Polymarket_M Category Kalshi_M Polymarket_M Sports $2.7K $1.2K Crypto $285.29 $635.67 Exotics $256.27 — Politics $24.96 $529.00 Trump — $65.73 (function() { function _ptmInit() { var el = document.getElementById('ptm-chart-2'); if (!el) return; var ctx = el.getContext('2d'); new Chart(ctx, { type: 'bar', data: { labels: ["Sports","Crypto","Exotics","Politics","Trump"], datasets: [{"type":"bar","label":"Kalshi_M","data":[2670.23,285.29,256.27,24.96,0],"backgroundColor":"#00d4aa","borderRadius":4,"borderSkipped":false,"maxBarThickness":44,"yAxisID":"yLeft","order":2},{"type":"bar","label":"Polymarket_M","data":[1222.43,635.67,0,529,65.73],"backgroundColor":"#7c3aed","borderRadius":4,"borderSkipped":false,"maxBarThickness":44,"yAxisID":"yLeft","order":2}] }, options: { responsive: true, maintainAspectRatio: false, layout: { padding: { top: 8, bottom: 4 } }, interaction: { intersect: false, mode: 'index' }, plugins: { legend: { display: false }, tooltip: { backgroundColor: '#0f172a', titleFont: { family: "'Plus Jakarta Sans', sans-serif", size: 11, weight: 600 }, bodyFont: { family: "'Plus Jakarta Sans', sans-serif", size: 11 }, padding: { x: 10, y: 8 }, cornerRadius: 6, callbacks: { label: function(ctx) { var fmt = ctx.dataset.yAxisID === 'yRight' ? 'compact' : 'number'; return ctx.dataset.label + ': ' + ptmCharts.formatValue(ctx.parsed.y, fmt); } } } }, scales: { x: { grid: { display: false }, ticks: { font: { family: "'Plus Jakarta Sans', sans-serif", size: 11, weight: 500 }, color: '#8a90a0' } }, yLeft: { type: 'linear', position: 'left', beginAtZero: true, grid: { color: 'rgba(0,0,0,0.05)', drawBorder: false }, border: { display: false }, title: { display: false, text: "", color: '#8a90a0', font: { family: "'Plus Jakarta Sans', sans-serif", size: 10, weight: 500 } }, ticks: { font: { family: "'Plus Jakarta Sans', sans-serif", size: 11 }, color: '#8a90a0', padding: 8, callback: function(val) { return ptmCharts.formatValue(val, 'number'); } } }, yRight: { type: 'linear', position: 'right', beginAtZero: true, grid: { drawOnChartArea: false }, border: { display: false }, title: { display: false, text: "", color: '#8a90a0', font: { family: "'Plus Jakarta Sans', sans-serif", size: 10, weight: 500 } }, ticks: { font: { family: "'Plus Jakarta Sans', sans-serif", size: 11 }, color: '#8a90a0', padding: 8, callback: function(val) { return ptmCharts.formatValue(val, 'compact'); } } } } } }); } if (typeof Chart !== 'undefined') { _ptmInit(); } else { document.addEventListener('DOMContentLoaded', _ptmInit); } })();Round 1 games dominated Kalshi’s top markets for the week. Among the highest-volume matchups: Vanderbilt at Nebraska ($9.9M), Texas at Gonzaga ($7.5M), High Point at Arkansas ($7.5M), Louisville at Michigan State ($7.3M), and TCU at Duke ($6.9M). For context, the top Round 1 game on Kalshi drew more volume than any single game in the platform’s weekly top 10 just two weeks ago, when conference tournament games were considered a milestone. Kalshi also offers spread and total points markets alongside moneylines for each game — Texas at Gonzaga: Spread drew $1.7M separately, and TCU at Duke: Spread added another $3.2M — meaning per-matchup volume is meaningfully higher than any single contract suggests.
The futures market tells the longer story. Kalshi’s Men’s College Basketball Champion market has accumulated $91.4 million in open interest, with Michigan (21%), Arizona (20%), and Duke (18%) leading. That OI figure, larger than any single weekly top-10 market, reflects traders with positions that run through April 7.
Beyond sports, Kalshi’s Crypto category grew 22.1% week-over-week to $285.3M, and Politics was up 30.3% to $25.0M. The Entertainment category collapsed 87.8% to $7.6M, which was entirely expected, as the prior week captured Oscars Sunday trading volume that has now settled off the board.
Kalshi’s Unknown category dropped 62.2% to $72.8M, which could be from Dune Analytics reclassifying newly created tournament contracts into the Sports category as matchups were confirmed after bracket release.
Polymarket: Sports approaches parity with non-sports for the first time
Polymarket’s $2.54 billion week was driven by a rotation that doesn’t show up clearly in the top-line number. Sports volume surged 32.2% to $1.22 billion, its largest weekly sports total in the tracking period, pushing sports concentration from 39.5% to 48.1%. That’s the closest Polymarket has come to a 50/50 sports/non-sports split since we began tracking category data.
The NCAA Tournament was the catalyst on Polymarket too, though at a smaller scale than Kalshi. The platforms’ top NCAA markets overlapped in teams but not in contract structure: where Kalshi runs per-game moneylines and spreads, Polymarket’s highest-volume tournament market for the week was the 2026 NCAA Tournament Winner futures contract ($2.1M weekly, $980K OI), with Arizona and Michigan co-leading at 20% each, Duke at 17%. Individual game moneylines on Polymarket also drew volume — VCU vs. Illinois ($4.1M) and Texas vs. Gonzaga ($3.1M) were both in the cross-platform top 30 — but Polymarket’s game-level volume runs at a fraction of Kalshi’s for comparable matchups.
The more interesting story on Polymarket is what didn’t happen to politics. Politics and Trump combined fell 11.6% to $594.7M — a real decline in an otherwise up week. The Fed’s March rate decision, which topped Polymarket’s leaderboard last week at $141.9M, has now resolved. What’s replacing it is 2028 presidential positioning: the Republican Presidential Nominee 2028 market led Polymarket’s 7-day volume at $11.6M (J.D. Vance at 37%, Marco Rubio at 27%), and the Democratic Presidential Nominee 2028 market followed at $8.9M (Gavin Newsom at 25%). Both carry substantial open interest — $14.1M and $10.1M respectively — indicating these aren’t short-term event trades but positions traders are holding through the cycle. The 2028 Presidential Election market added another $2.8M in weekly volume with $35.0M in OI, the largest open interest figure on the board.
Culture dropped 47.1% — again, Oscars effect. Crypto was essentially flat at $635.7M (+1.6%), maintaining its position as Polymarket’s second-largest category behind Sports.
Polymarket still dominates in terms of non-sports volume, which is now larger than Kalshi’s non-sports volume by almost 2x: $1.34B versus $726M. As noted in previous reports, the two platforms are serving meaningfully different trader populations at this point. Kalshi is running 78.6% sports this week, while Polymarket is running 51.9% non-sports.
Full platform comparison
Total industry volume across all Dune-tracked platforms reached $6.41B for the week of March 16–22, up 11.4% from $5.76B the prior week. Kalshi and Polymarket combined accounted for 93.4% of total tracked volume, continuing the consolidation trend that has characterized the past two months.
Prediction Markets platform comparison: Week of March 16-22
PNG Embed CSV Share Prediction Markets platform comparison: Week of March 16-22 Platform Vol_Mar9_M Vol_Mar16_M Vol_WoW_Pct Tx_Mar9_M Tx_Mar16_M Tx_WoW_Pct Kalshi $2.9K $3.4K 15.70% 19.75 21.44 8.60% Polymarket $2.3K $2.5K 8.50% 24.67 27.36 10.90% Crypto.com $156.10 $158.66 1.60% Limitless $128.13 $98.46 -23.20% 0.35 0.30 -14.10% Opinion $77.91 $128.54 65.00% 0.11 0.08 -31.20% predict.fun $91.15 $60.33 -33.80% 0.11 0.09 -17.30% Other $20.62 $23.51 14.00% 0.24 0.35 44.50% Overtime $4.04 $4.04 ~flat 0.01 0.01 -9.30% (function() { function _ptmInit() { var el = document.getElementById('ptm-chart-3'); if (!el) return; var ctx = el.getContext('2d'); new Chart(ctx, { type: 'bar', data: { labels: ["Kalshi","Polymarket","Crypto.com","Limitless","Opinion","predict.fun","Other","Overtime"], datasets: [{"label":"Vol_Mar9_M","data":[2934.75,2344.27,156.1,128.13,77.91,91.15,20.62,4.04],"backgroundColor":["#00D4AA","#7C3AED","#F97316","#0EA5E9","#EC4899","#14B8A6","#6366F1","#00D4AA"],"borderRadius":4,"maxBarThickness":64}] }, options: { responsive: true, maintainAspectRatio: false, layout: { padding: { top: 8, bottom: 4 } }, plugins: { legend: { display: false }, tooltip: { backgroundColor: '#0f172a', titleFont: { family: "'Plus Jakarta Sans', sans-serif", size: 11, weight: 600 }, bodyFont: { family: "'Plus Jakarta Sans', sans-serif", size: 11 }, padding: { x: 10, y: 8 }, cornerRadius: 6, displayColors: false, callbacks: { label: function(ctx) { return ctx.dataset.label + ': ' + ptmCharts.formatValue(ctx.parsed.y, 'number'); } } } }, scales: { x: { grid: { display: false }, ticks: { font: { family: "'Plus Jakarta Sans', sans-serif", size: 11, weight: 500 }, color: '#8a90a0' } }, y: { beginAtZero: true, grid: { color: 'rgba(0,0,0,0.05)', drawBorder: false }, border: { display: false }, ticks: { font: { family: "'Plus Jakarta Sans', sans-serif", size: 11 }, color: '#8a90a0', padding: 8, callback: function(val) { return ptmCharts.formatValue(val, 'number'); } } } } } }); } if (typeof Chart !== 'undefined') { _ptmInit(); } else { document.addEventListener('DOMContentLoaded', _ptmInit); } })();Opinion Markets rebounded 65.0% to $128.5M after five consecutive weeks of decline. It’s worth noting, though, it remains far below its $1.81B peak from late December and the bounce may be noise rather than a trend reversal. Crypto.com held steady at $158.7M (+1.6%). Limitless fell 23.2% to $98.5M and predict.fun declined 33.8% to $60.3M.
On transactions, Polymarket maintained its lead with 27.4M versus Kalshi’s 21.4M, a 56/44 split that has been consistent for months. Total industry transactions hit 49.6M across all tracked platforms, up 9.7% week-over-week.
Note: Comparing smaller platforms over time is not fully reliable given how Dune groups certain platforms — Limitless, Myriad, and ForecastEx have been consolidated under “Other” at various points in the tracking period. Week-over-week changes for these platforms should be treated as directional rather than precise.
Polymarket US check-in
Polymarket US generated $5.9M in weekly notional volume, flat versus the prior week despite the NCAA Tournament launch. The platform added 108 active markets to reach 596, with Round 1 game lines now available — but individual contract volume remains in the low five figures for most games. Texas at Gonzaga drew $182.6K on Polymarket US; the same game did $7.5M on global Polymarket and far more on Kalshi.
Open interest grew meaningfully to $8.2M, up from $1.1M the week prior, as NCAA tournament futures accumulated. The volume ceiling for individual US-market contracts hasn’t shifted yet, but the OI growth suggests traders are taking positions rather than just watching.
What comes next
The Round of 32 runs through Sunday, March 22, and the Sweet 16 tips off Thursday, March 27. Based on Kalshi’s conference tournament performance two weeks ago, where individual games drew $7-10M, Round of 32 matchups involving major programs could easily clear those levels. The games with the most volume potential are the ones pitting high-seeded programs with large national fanbases against credible upset threats. Duke ($6.9M in Round 1 on Kalshi), Michigan ($5.4M), and Texas ($7.5M) are the early indicators of where trader attention is concentrated. The Men’s College Basketball Champion futures market at $91.4M in OI will continue to price in real-time as the bracket tightens.
Longer-term, the question is what Kalshi’s volume trajectory looks like after the tournament ends in early April. The platform has now set back-to-back weekly volume records during the college basketball calendar, following a pattern established during the NFL season. Whether that translates to sustained $3B+ weeks during the NBA playoffs alone, without the tournament’s per-game volume density, is the target number to watch in Q2.
The post Kalshi Hits Record $3.4B Week, Polymarket Sports Surge as March Madness Heats Up appeared first on DeFi Rate.
Related Articles
Stablecoin Yield Debate Pits Wall Street Against Crypto as US Nears Policy Breakthrough
A potential breakthrough on stablecoin yield signals a shift in US policymakers'...
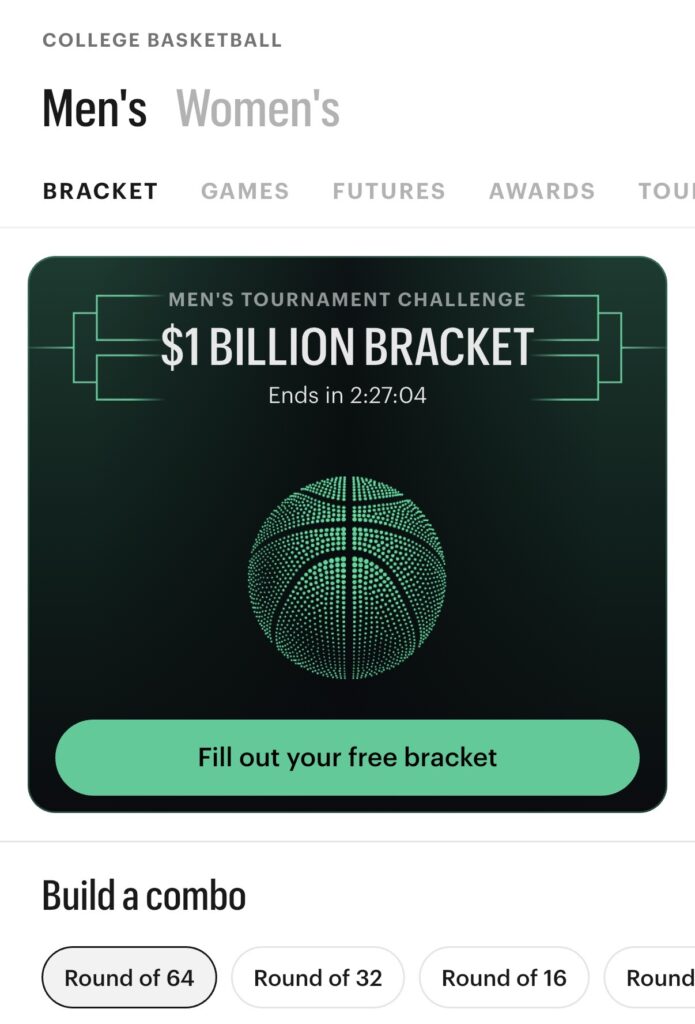
Kalshi $1 Billion Perfect March Madness Bracket Deadline Nears
Kalshi is offering $1 billion for a perfect March Madness bracket or $1 million...
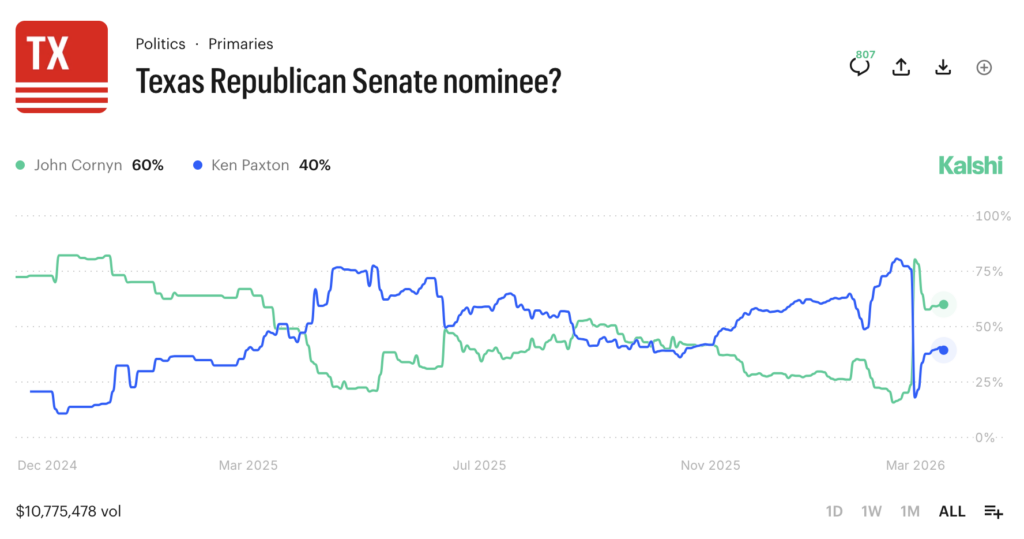
Texas Senate GOP Race Tightens as Trump Skips Key Endorsement Deadline
Texas Republican Senate runoff odds stay tight at prediction markets as traders...
Arizona AG Files Criminal Charges Against Kalshi in Escalating State Battle
Arizona AG Kris Mayes hit the prediction market platform with a 20-count crimina...