LIC Housing Finance Forms Inverted Head & Shoulders Pattern; Check the Chart and Details
Alex Smith
5 hours ago

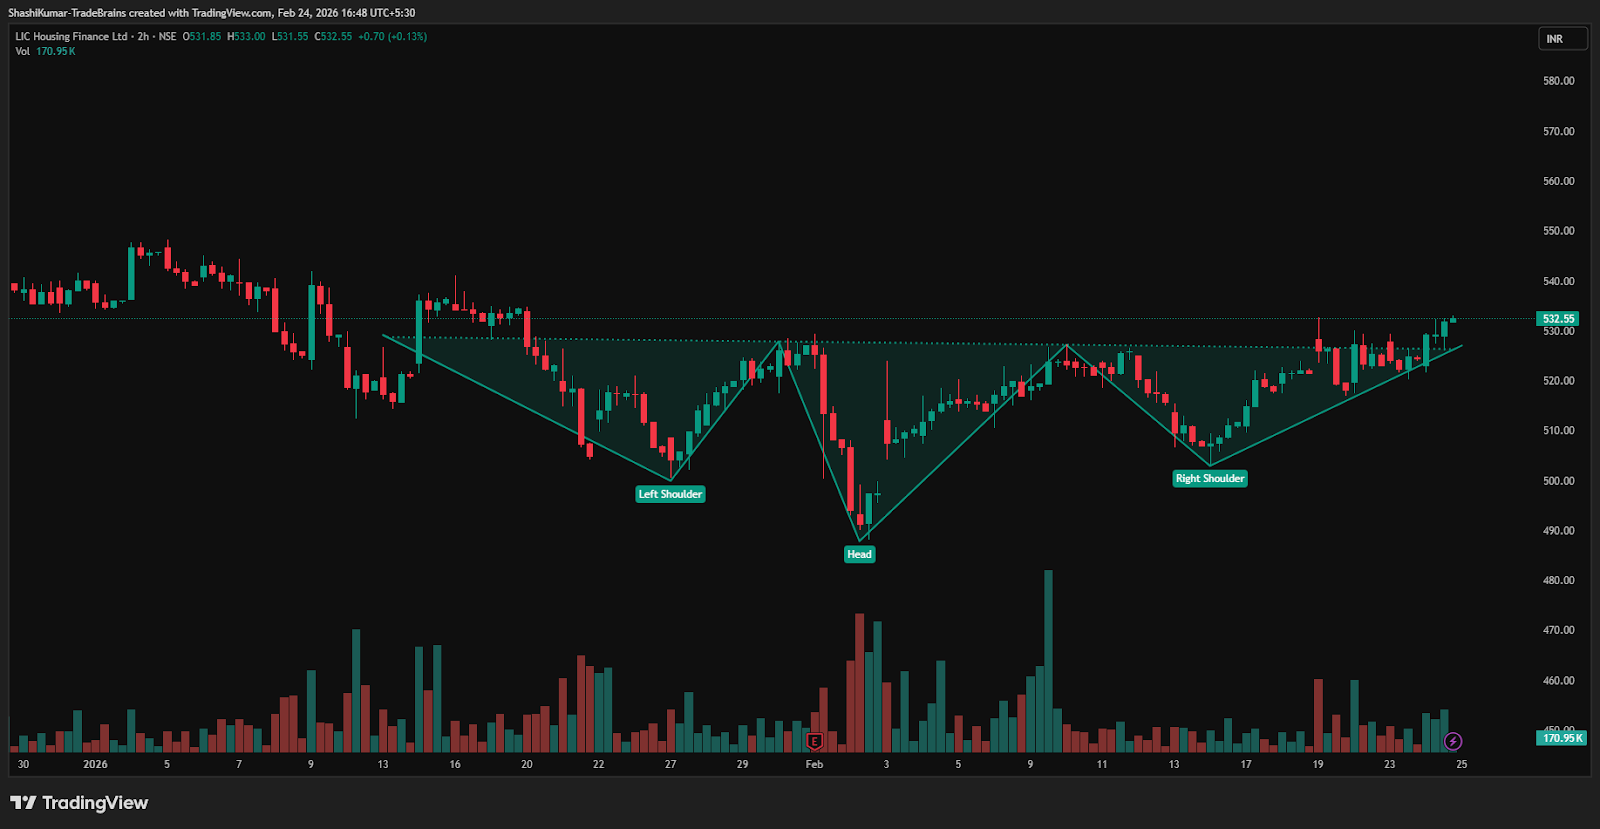
Synopsis: LIC Housing Finance Ltd has developed an inverted head and shoulders pattern on the 2-hour chart, suggesting a possible short-term bullish reversal.
The inverted head-and-shoulders pattern indicates weakening selling pressure and rising buying interest, suggesting a potential bullish reversal. The inverted head-and-shoulders pattern features three troughs, with the middle trough (the head) lower than the two higher troughs (the shoulders). A breakout above the neckline signals a potential bullish reversal.
On Tuesday, LIC Housing Finance Ltd broke above the neckline of an inverted head-and-shoulders pattern on the two-hour chart. A sustained move above Rs 526 could trigger further gains, while a decline below this level may dampen the near-term bullish sentiment.
LIC Housing Finance Ltd Chart: 2-hour Timeframe
In an inverted head-and-shoulders pattern, price targets are set at nearby resistance levels or by projecting the distance from the head to the neckline above the breakout point. Traders typically trail profits while tracking volume and momentum indicators for confirmation of sustained strength.
Indicator Confirmation
- RSI: The daily RSI indicates bullish momentum, as it rose from 53.2 in the previous trading session to 57.4 on Tuesday, confirming the bullish reversal.
- MACD: On the daily time frame, the blue MACD line was above the orange signal line, with the histogram turning green, indicating bullish momentum.
- Moving Averages: On the daily time frame, the 5-day moving average was above the 9-day moving average, further confirming a bullish trend.
- Price Volume Trend: The Price Volume Indicator confirms the uptrend, accompanied by a sharp increase in buying volume in the daily time frame.
Implications
The inverted head-and-shoulders pattern indicates possible upward movement. Holding above the key Rs 526 support level, backed by strong trading volumes, would reinforce near-term bullish momentum.
About the stock
LIC Housing Finance Ltd is the largest housing finance company, with an extensive nationwide network and a representative office in Dubai. It also markets products through LIC HFL Financial Services Ltd. Promoted by Life Insurance Corporation in 1989, it went public in 1994 and issued GDRs in 2004. It holds the highest ratings from CRISIL and CARE.
Over the past month, LIC Housing Finance Ltd has gained 4.34%. However, the stock has declined 5.15% over the last six months and delivered a marginal negative return of 0.94% over the past year. For more such technical stock ideas, click here to view our research page.
Disclaimer: The views and investment tips expressed by investment experts/broking houses/rating agencies on tradebrains.in are their own, and not that of the website or its management. Investing in equities poses a risk of financial losses. Investors must therefore exercise due caution while investing or trading in stocks. Trade Brains Technologies Private Limited or the author are not liable for any losses caused as a result of the decision based on this article. Please consult your investment advisor before investing.
The post LIC Housing Finance Forms Inverted Head & Shoulders Pattern; Check the Chart and Details appeared first on Trade Brains.
Related Articles

Afcons Infrastructure Shares Fall 4% After Client Terminates Order
Synopsis: A construction company fell after a Gabon road project was terminated...

3:1 Bonus Issue: IT Stock in Focus as the Company Turns Ex-Bonus on February 27
Synopsis: A small-cap stock has announced a 3:1 bonus issue with February 27, 20...

Lower Circuit: Why Did SpiceJet Shares Crash 10% Today?
Synopsis: SpiceJet shares hit the 10% lower circuit after nearly 15 crore shares...

Why did Nifty IT index jump by up to 3% today? Here’s the reason
Synopsis: Indian IT stocks rallied up to 3% as global tech shares rebounded afte...