Pharma Stock Turns Bearish Following Inverted Flag and Pole Pattern Formation; Check the details
Alex Smith
3 weeks ago

Synopsis: Natco Pharma Ltd has exhibited a bearish pattern on its 30-minute chart, signalling potential near-term downward momentum.
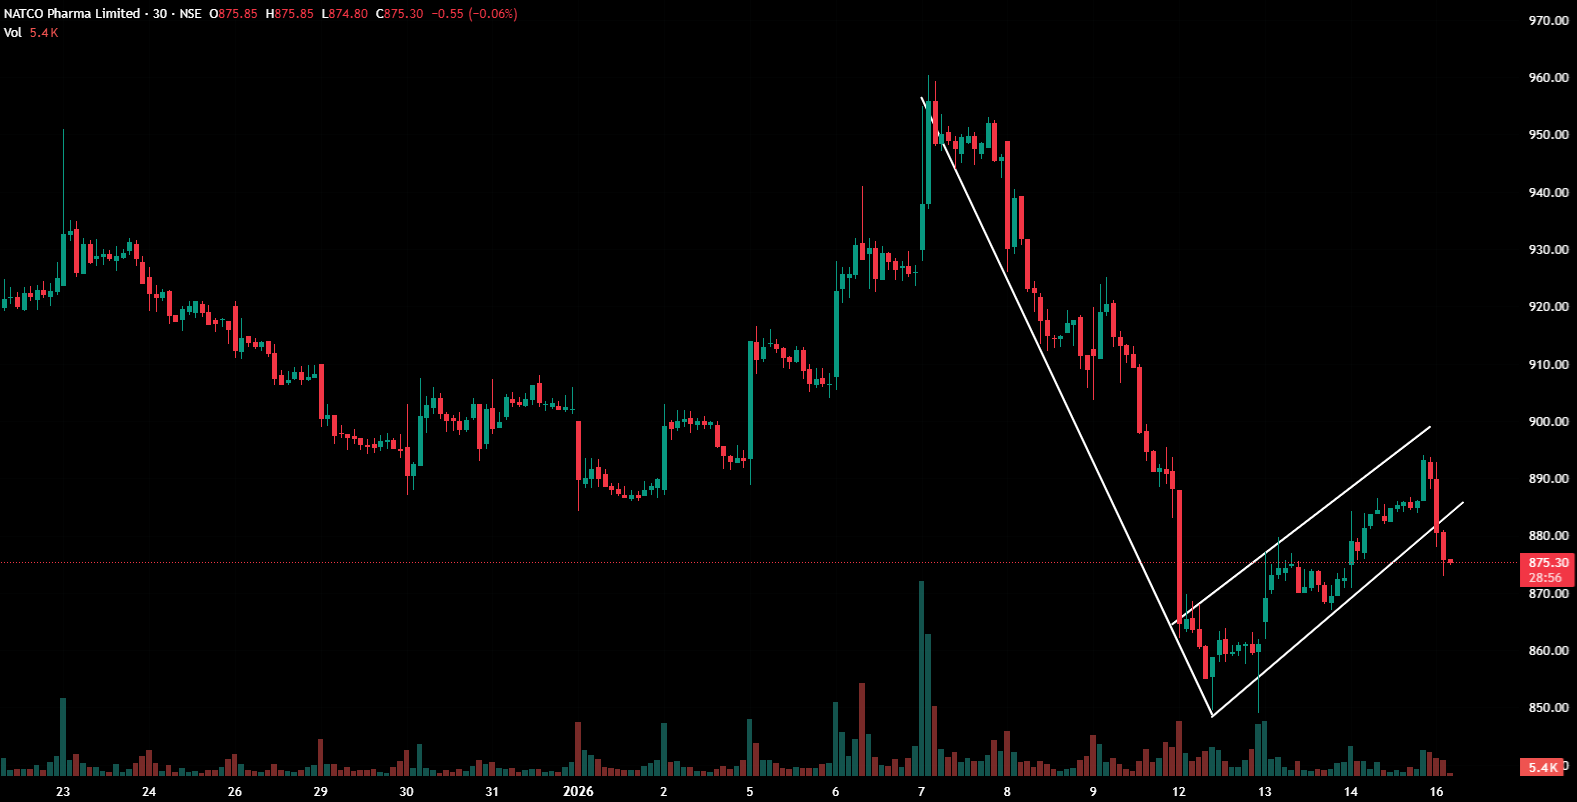
Natco Pharma, after a prolonged downtrend and a brief corrective uptrend, has formed an inverted flag and pole pattern on the 30-minute timeframe, indicating potential bearish momentum.
(30-minute Timeframe)
The inverted Flag & Pole pattern represents a continuation of a prevailing downtrend, where a sharp decline (the pole) is followed by a brief, upward or sideways consolidation (the flag). This consolidation typically occurs within a narrow range and reflects temporary profit booking before the broader bearish trend resumes. A decisive breakdown below the lower boundary of the flag signals a continuation of bearish momentum, indicating that sellers have regained control, and downside pressure may intensify.
On Friday, the stock broke below the Rs 880 flag line after forming an inverted Flag & Pole pattern. This breakdown, coupled with sustained selling pressure, confirms near-term bearish momentum.
For an inverted Flag & Pole pattern, the downside target is typically estimated by extending the length of the pole downward from the breakdown point, with nearby support levels used as practical target zones. Traders often book partial or full profits around these support areas while closely monitoring price action for continuation or early signs of reversal.
Indicator Confirmation
- RSI: The daily RSI shows bearish momentum, as it dropped from ~49 in the last trading session to ~44 on Friday, confirming the continuation of the downtrend.
- MACD: The orange signal line crossed above the Blue MACD line, with the histogram turning red, indicating bearish momentum.
- Moving Averages: On the 30-minute time frame, the 5-day moving average has crossed below the 9-day moving average, further confirming a bearish trend.
- Price Volume Trend: The Price Volume Indicator remains flat, indicating a lack of buying volume and limited participation from buyers.
Implications
This inverted Flag & Pole breakdown indicates the potential for further downside momentum. A decisive close below the flag’s lower boundary, preferably accompanied by higher volumes, is required to confirm the move and reduce the risk of a false breakdown. On the upside, immediate resistance is expected near Rs 890, while sustained trading below the breakdown zone would signal continued bearish pressure.
About the stock
Natco Pharma Ltd is engaged in the development, manufacturing, and distribution of generic and branded pharmaceuticals, specialty products, active pharmaceutical ingredients (APIs), and crop protection solutions. The company is strongly R&D-focused and science-driven, with a leadership position in oncology, particularly in targeted therapies, within the domestic market, while concentrating on limited-competition molecules in the US market. Its manufacturing facilities are approved by leading global regulatory authorities, including the US FDA, Brazil’s ANVISA, Health Canada, and the WHO, enabling the company to serve more than 50 international markets.
Over the past month, Natco Pharma Ltd has declined by 5.7%. The stock has fallen further by 14.9% over the last six months and has delivered a negative return of 30.25% over the past year. For more such technical stock ideas, Click here to view our research page.
Disclaimer: The views and investment tips expressed by investment experts/broking houses/rating agencies on tradebrains.in are their own, and not that of the website or its management. Investing in equities poses a risk of financial losses. Investors must therefore exercise due caution while investing or trading in stocks. Trade Brains Technologies Private Limited or the author are not liable for any losses caused as a result of the decision based on this article. Please consult your investment advisor before investing.
The post Pharma Stock Turns Bearish Following Inverted Flag and Pole Pattern Formation; Check the details appeared first on Trade Brains.
Related Articles
Why did KPIT Technologies share crash up to 29% in one month?
Synopsis: KPIT Technologies Limited shares fell nearly 29% in a month amid Europ...

Solar Industries, Caplin Point and 6 other stocks delivering back-to-back EPS growth
Synopsis: Stocks like Solar Industries, Waaree Energies, and Navin Fluorine and...

Will Max Financial share price cross ₹2,000 after announcing robust Q3 results?
Synopsis: Max Financial gains after robust Q3 performance; Jefferies reiterates...

Angel One Vs Groww: Which stockbroker performed better in Q3?
Synopsis: Angel One and Groww delivered contrasting performances in Q3 FY26. Ang...