SBI LIFE Stock Forms An Ascending Triangle Pattern Hinting At A Short-Term Bullish Breakout
Alex Smith
3 hours ago

Synopsis: SBILIFE has formed an ascending triangle on the 30-min chart, signalling a possible short-term bullish breakout.
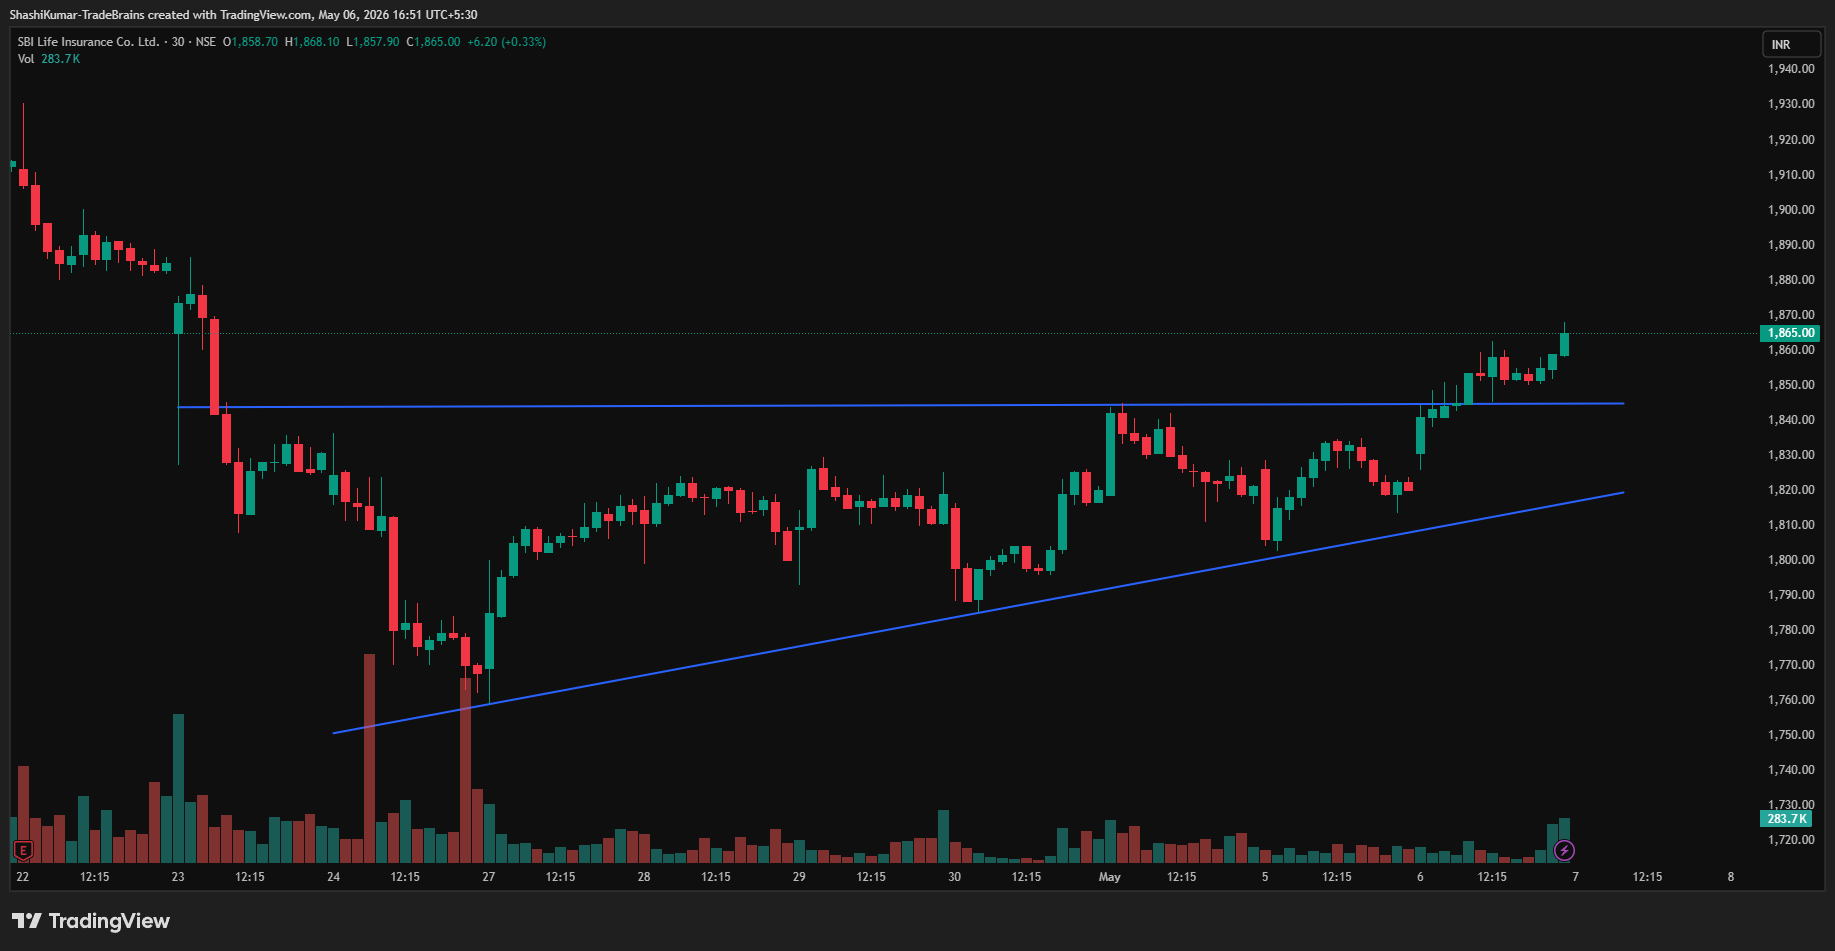
An ascending triangle is a bullish continuation pattern marked by higher lows and a flat resistance line. The chart shows a confirmed bullish breakout above the resistance neckline. Supported by volume surge and points to a potential short-term upward move.
On Wednesday, SBI LIFE broke the resistance neckline and sustained above the Rs 1,845 level, which is now acting as a support zone in the 30-min. chart, reinforcing its bullish momentum.
In an ascending triangle, traders typically target the nearest resistance level or project a price move equal to the triangle’s height from the breakout point, using strong volume and momentum to confirm the trade.
SBI Life Insurance Company Ltd Chart: 30-min Timeframe
Indicator Confirmation
- RSI: The daily RSI indicates buying pressure, as it rose from 41.85 in the previous trading session to 48.29 on Wednesday.
- Price Volume Trend: The Price Volume Indicator confirms the uptrend, accompanied by an increase in buying volume in the daily time frame.
Implications
The ascending triangle pattern indicates continued upside potential. Maintaining levels above the Rs 1,845 support mark, especially with strong trading volumes, would further strengthen the near-term bullish outlook.
About the stock
SBI Life Insurance Company Limited is one of India’s leading private life insurance companies, established in 2000. The company offers a wide range of insurance products, including term plans, savings plans, retirement solutions, ULIPs, and child plans. With a strong distribution network and digital services, SBI Life has built a trusted presence in the Indian insurance industry.
Over the past month, SBILIFE has risen 1.75%, and the stock is down 5.17% over the past six months and has risen an 8.28% increase year-over-year. For more such technical stock ideas, click here to view our research page.
Disclaimer: The views and investment tips expressed by investment experts/broking houses/rating agencies on tradebrains.in are their own, and not that of the website or its management. Investing in equities poses a risk of financial losses. Investors must therefore exercise due caution while investing or trading in stocks. Trade Brains Technologies Private Limited or the author are not liable for any losses caused as a result of the decision based on this article. Please consult your investment advisor before investing.
The post SBI LIFE Stock Forms An Ascending Triangle Pattern Hinting At A Short-Term Bullish Breakout appeared first on Trade Brains.
Related Articles

R Systems Shares Rise 3% as Revenue Crosses ₹574 Cr and PAT Surges 70%
Synopsis:- Declaring its first quarterly results under a merged entity, R System...

Rossari Biotech: Can Pharma, Agro and Global Exports Fuel Its Next Growth Cycle?
Synopsis: Rossari Biotech Limited delivered 15% revenue growth in FY26, supporte...

Jagsonpal Pharma Announces ₹40 Crore Buyback at ₹250 Per Share; Promoters to Skip Tender Offer
Synopsis :Jagsonpal Pharmaceuticals Limited has announced a share buyback worth...
RR Kabel: Can ₹1,200 Cr Capex, Strong Q4, and High Future Growth Be an Opportunity to Buy the Stock?
Synopsis: R R Kabel shows strong growth backed by demand and expansion plans, wi...