Solana (SOL) At Risk of Fresh Bearish Wave, Traders Turn Cautious
Alex Smith
1 month ago
Solana failed to stay above $126 and corrected gains. SOL price is now trading below $125 and might find bids near the $120 zone.
- SOL price started a downside correction below $125 against the US Dollar.
- The price is now trading above $125 and the 100-hourly simple moving average.
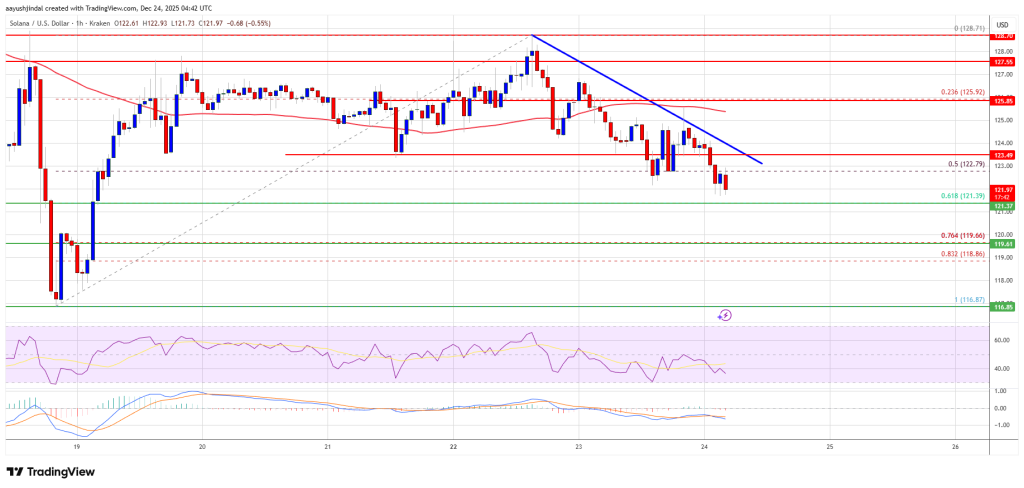
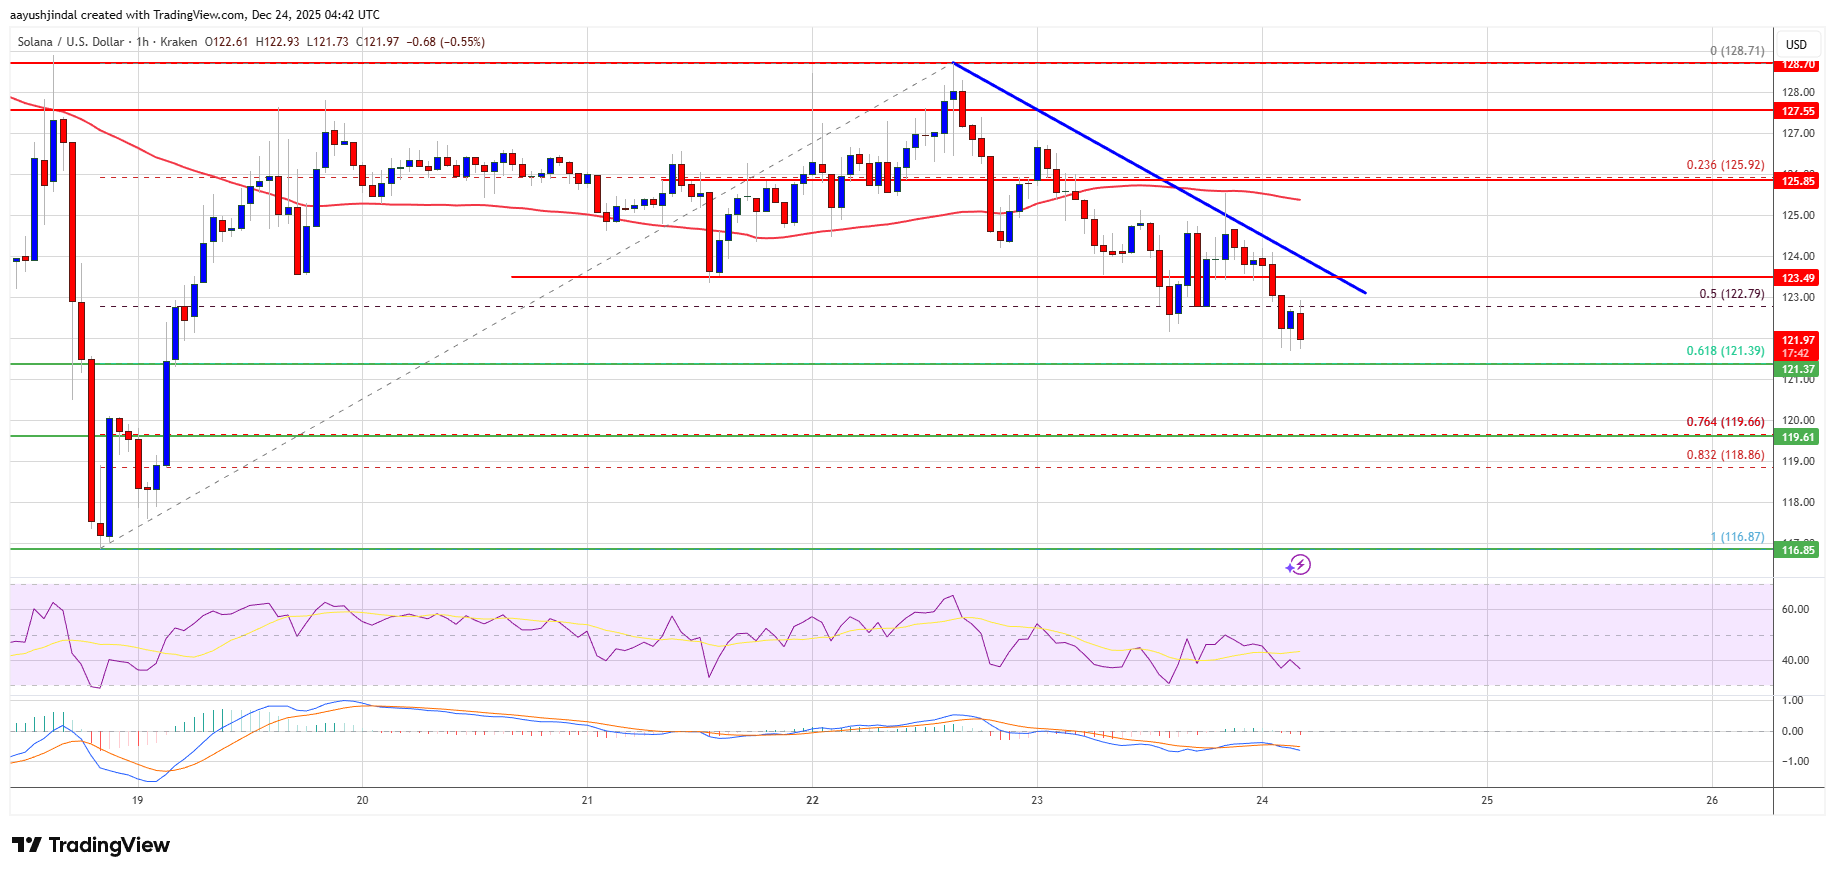
- There is a bearish trend line forming with resistance at $124 on the hourly chart of the SOL/USD pair (data source from Kraken).
- The pair could extend losses if it dips below the $120 zone.
Solana Price Starts Downside Correction
Solana price failed to surpass $130 and started a downside correction, like Bitcoin and Ethereum. SOL dipped below $126 and $125 to enter a short-term bearish zone.
There was a move below the 50% Fib retracement level of the upward wave from the $117 swing low to the $127 high. However, the bulls are active near $122. Besides, there is a bearish trend line forming with resistance at $124 on the hourly chart of the SOL/USD pair.
Solana is now trading below $125 and the 100-hourly simple moving average. On the upside, the price is facing resistance near the $125 level and the trend line. The next major resistance is near the $128 level. The main resistance could be $130. A successful close above the $130 resistance zone could set the pace for another steady increase. The next key resistance is $135. Any more gains might send the price toward the $142 level.
More Losses In SOL?
If SOL fails to rise above the $125 resistance, it could start another decline. Initial support on the downside is near the $122 zone. The first major support is near the $120 level and the 76.4% Fib retracement level of the upward wave from the $117 swing low to the $127 high.
A break below the $120 level might send the price toward the $112 support zone. If there is a close below the $112 support, the price could decline toward the $105 support in the near term.
Technical Indicators
Hourly MACD – The MACD for SOL/USD is gaining pace in the bearish zone.
Hourly Hours RSI (Relative Strength Index) – The RSI for SOL/USD is below the 50 level.
Major Support Levels – $122 and $120.
Major Resistance Levels – $125 and $128.
Related Articles
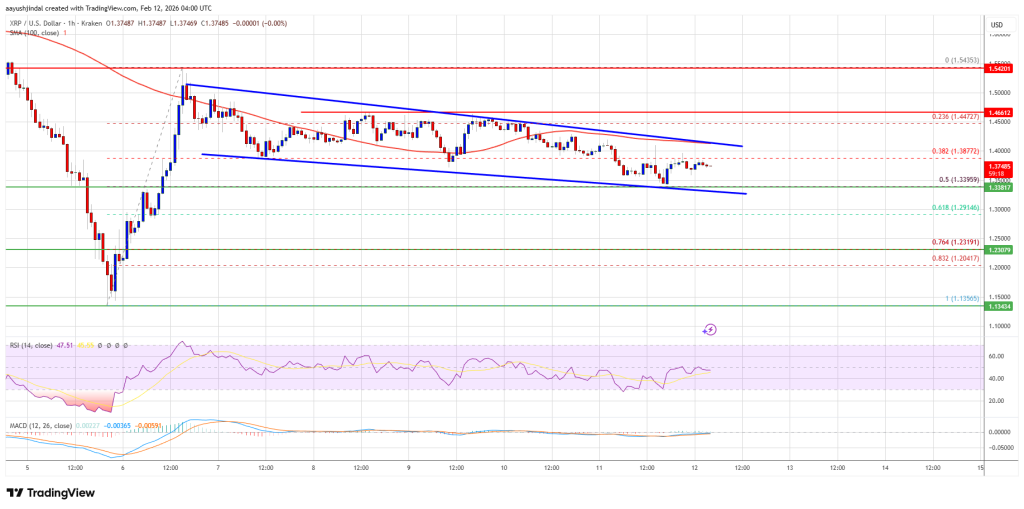
XRP Price Steadies Above Support, Break Higher Or Fade Again?
XRP price failed to surpass $1.50 and started another decline. The price is now...

Can HYPE Hold $25? Token Falls as Hyperliquid Quietly Gains Market Share
HYPE, the price ticker often used for the Hyperliquid ecosystem token (HYPE), ha...

Ethereum Price Cracks $2,000, Opening Door To Deeper Selloff
Ethereum price started a fresh decline and traded below $2,000. ETH is now conso...
More Bitcoin Ahead: Saylor, Strategy Commit To Regular BTC Purchases
Michael Saylor has doubled down on his company’s plan to keep buying Bitco...