Solana (SOL) Crashes Back To $112, A Level That Could Decide Everything
Alex Smith
1 week ago

Solana failed to settle above $125 and extended losses. SOL price is now consolidating losses below $120 and might struggle to start a recovery wave.
- SOL price started a fresh decline below $120 and $115 against the US Dollar.
- The price is now trading below $120 and the 100-hourly simple moving average.
- There is a key bearish trend line forming with resistance at $116 on the hourly chart of the SOL/USD pair (data source from Kraken).
- The price could start a recovery wave if the bulls defend $112 or $105.
Solana Price Dips Again
Solana price failed to remain stable above $125 and started a fresh decline, like Bitcoin and Ethereum. SOL declined below the $125 and $122 support levels.
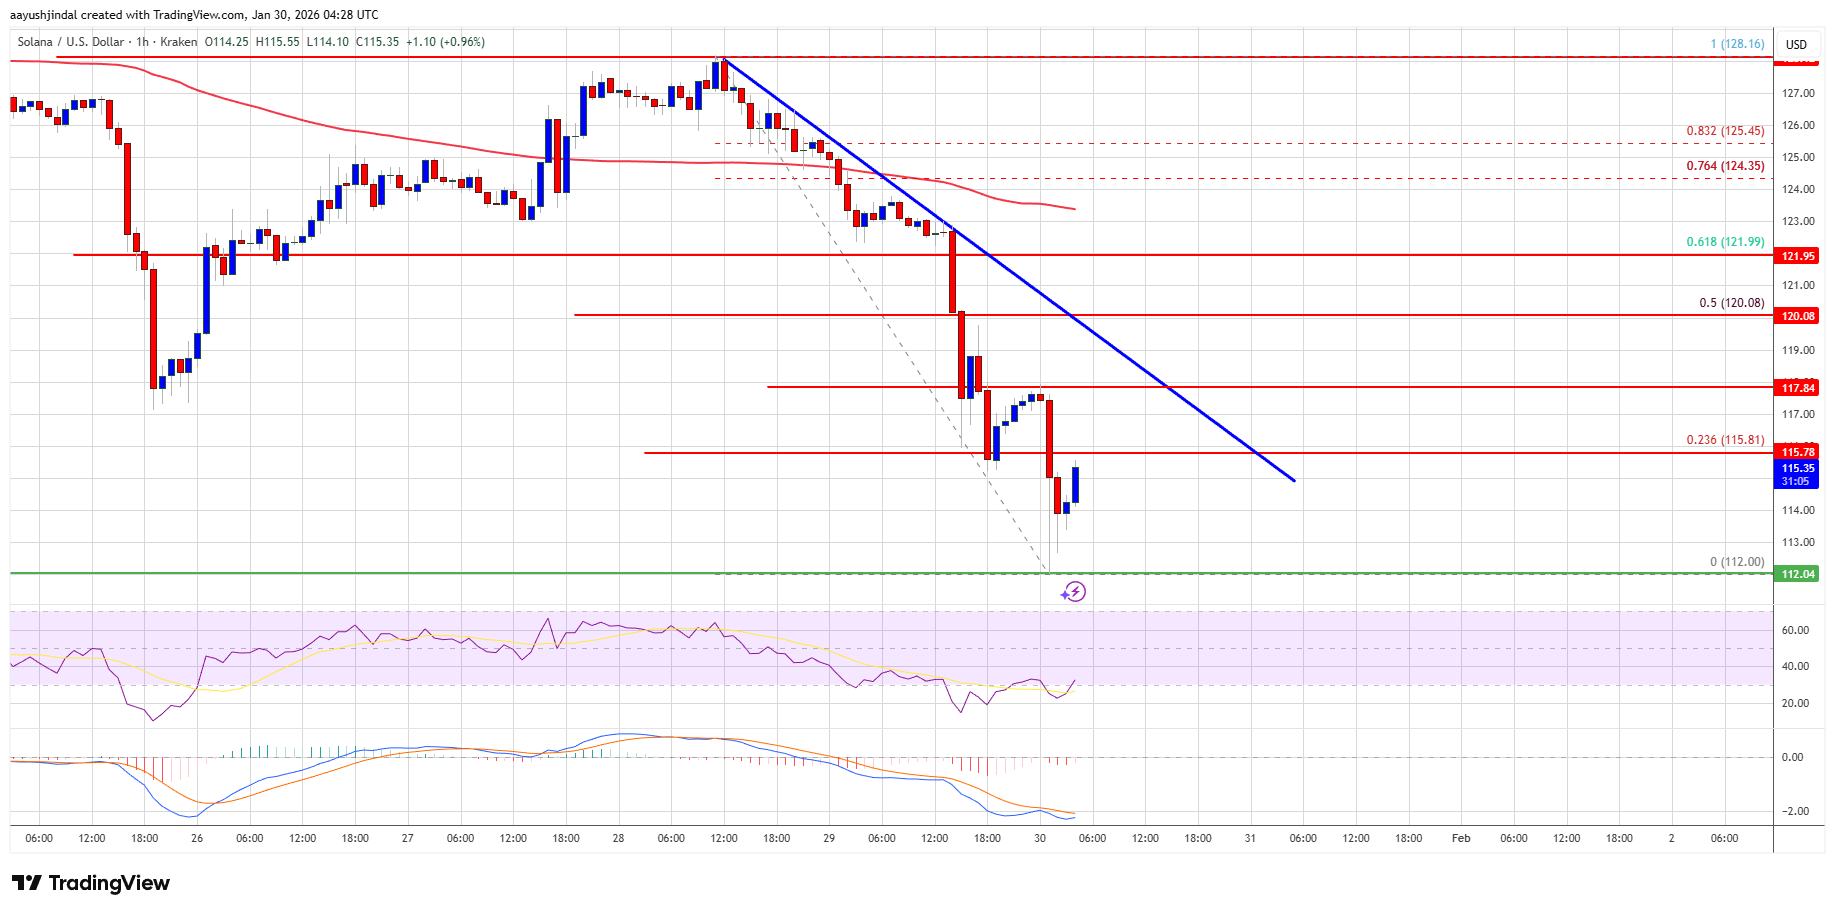
The price gained bearish momentum below $120. A low was formed at $112, and the price is now consolidating losses. The price recovered a few points and climbed toward the 23.6% Fib retracement level of the downward move from the $128 swing high to the $112 low.
Solana is now trading below $120 and the 100-hourly simple moving average. On the upside, immediate resistance is near the $116 level. There is also a key bearish trend line forming with resistance at $116 on the hourly chart of the SOL/USD pair.
The next major resistance is near the $120 level or the 50% Fib retracement level of the downward move from the $128 swing high to the $112 low. The main resistance could be $122. A successful close above the $122 resistance zone could set the pace for another steady increase. The next key resistance is $125. Any more gains might send the price toward the $132 level.
Another Drop In SOL?
If SOL fails to rise above the $116 resistance, it could continue to move down. Initial support on the downside is near the $114 zone. The first major support is near the $112 level.
A break below the $112 level might send the price toward the $105 support zone. If there is a close below the $105 support, the price could decline toward the $102 support in the near term.
Technical Indicators
Hourly MACD – The MACD for SOL/USD is losing pace in the bearish zone.
Hourly Hours RSI (Relative Strength Index) – The RSI for SOL/USD is below the 50 level.
Major Support Levels – $112 and $105.
Major Resistance Levels – $116 and $120.
Related Articles
UNI Rallies 10% As BlackRock Brings Treasury‑Backed BUIDL Token To Uniswap
Uniswap’s native token, UNI, posted a sharp gain on Wednesday after the world’s...

Here’s Why The XRP Price Has Been In A Consistent Downtrend Since 2025
On-chain data from Glassnode has unveiled the reason why the XRP price has been...
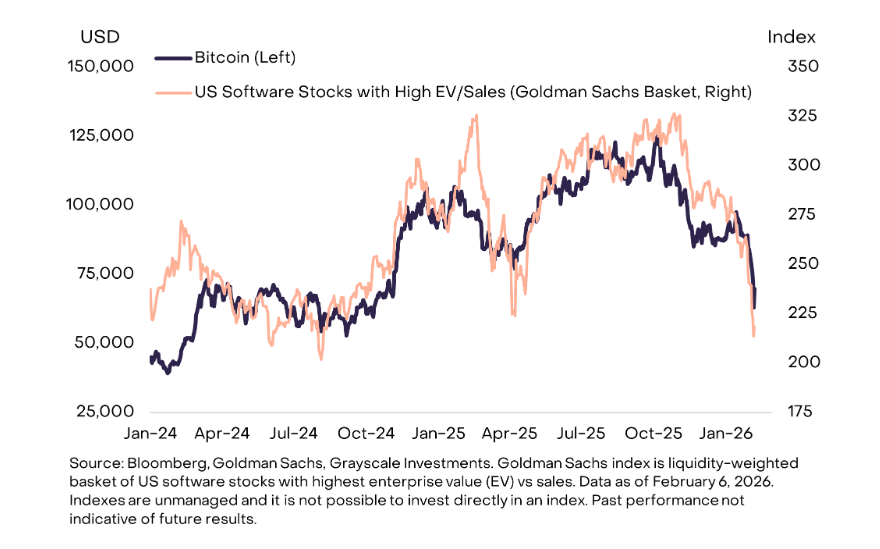
Bitcoin Moves With Tech, Not Precious Metals, Analysts Find
Bitcoin’s image as a steady store of value is being tested. What once was talked...

XRP ‘Looks Different’ This Cycle, Targets No. 2 Spot: Crypto Analyst
Crypto Insight UK director Will Taylor argued in a new video that XRP is “tradin...