Solana (SOL) Drops Into Bearish Zone, Key Supports Come Under Threat
Alex Smith
1 hour ago
Solana failed to settle above $92 and corrected most gains. SOL price is now consolidating losses above $84 and might attempt another increase.
- SOL price started a fresh decline below $90 and $88 against the US Dollar.
- The price is now trading below $87 and the 100-hourly simple moving average.
- There is a connecting bearish trend line forming with resistance at $85 on the hourly chart of the SOL/USD pair (data source from Kraken).
- The price could start a recovery wave if the bulls defend $84.00 or $82.50.
Solana Price Dips From $94
Solana price failed to remain stable above $92 and started a fresh decline, like Bitcoin and Ethereum. SOL declined below the $90 and $88 levels.
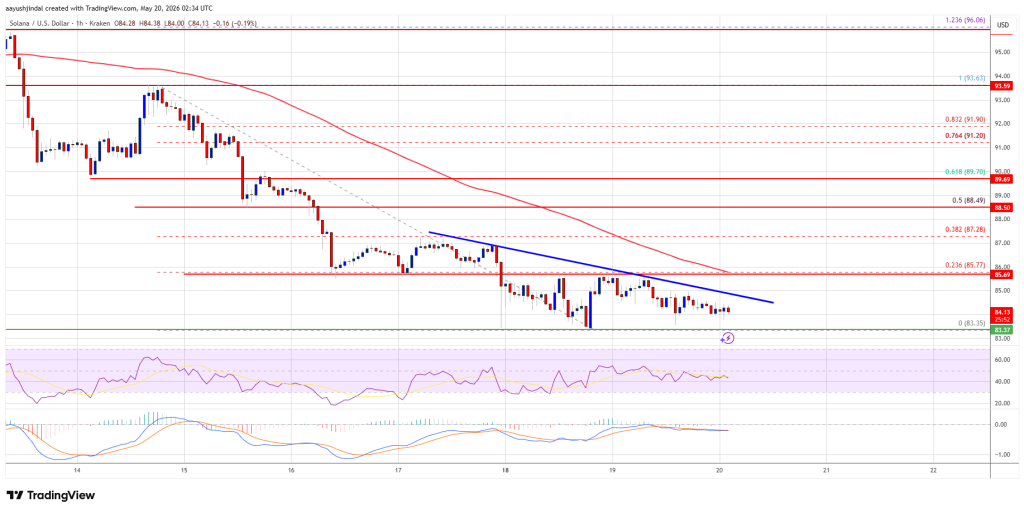
The bears even pushed the price toward $83. A low was formed at $83.35, and the price is now consolidating losses. The price is still showing bearish signs below the 23.6% Fib retracement level of the downward move from the $93.63 swing high to the $83.35 low.
Solana is now trading near $85 and the 100-hourly simple moving average. Besides, there is a connecting bearish trend line forming with resistance at $85 on the hourly chart of the SOL/USD pair.
On the upside, immediate resistance is near the $85 level. The next major resistance is near the $85.80 level. The main resistance could be $88.50 or the 50% Fib retracement level of the downward move from the $93.63 swing high to the $83.35 low. A successful close above the $88.50 resistance zone could set the pace for another steady increase. The next key resistance is $90. Any more gains might send the price toward the $92 level.
More Losses In SOL?
If SOL fails to rise above the $88.80 resistance, it could continue to move down. Initial support on the downside is near the $83.50 zone. The first major support is near the $82 level.
A break below the $82 level might send the price toward the $80 support zone. If there is a close below the $80 support, the price could decline toward the $75 support in the near term.
Technical Indicators
Hourly MACD – The MACD for SOL/USD is gaining pace in the bearish zone.
Hourly Hours RSI (Relative Strength Index) – The RSI for SOL/USD is below the 50 level.
Major Support Levels – $83.50 and $82.00.
Major Resistance Levels – $85.80 and $88.50.
Related Articles

XRP Breakout Loading? Key $1.50 Level Could Ignite Powerful Rally
XRP is approaching a crucial turning point as price action tightens within a maj...
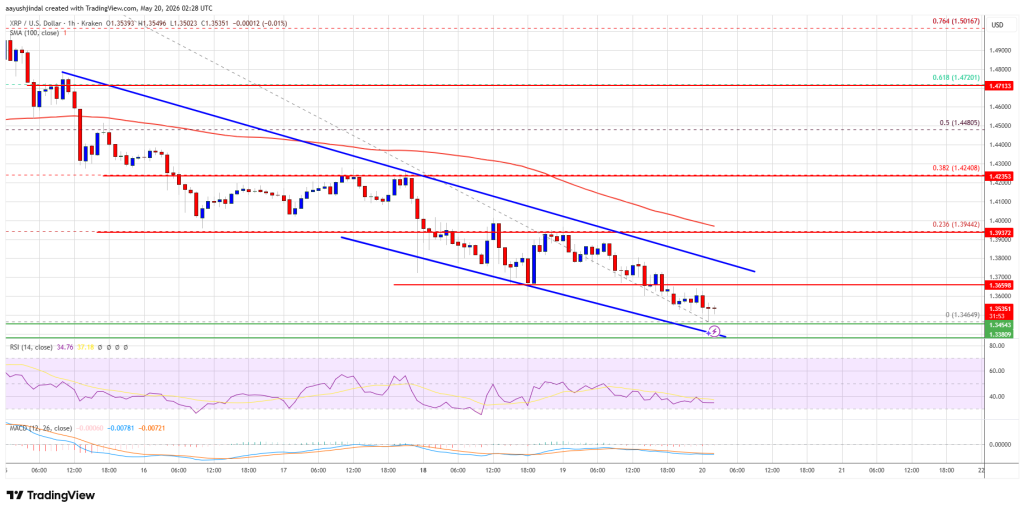
XRP Price Under Pressure Again, Traders Brace For More Weakness
XRP price extended losses and traded below $1.40. The price is now consolidating...
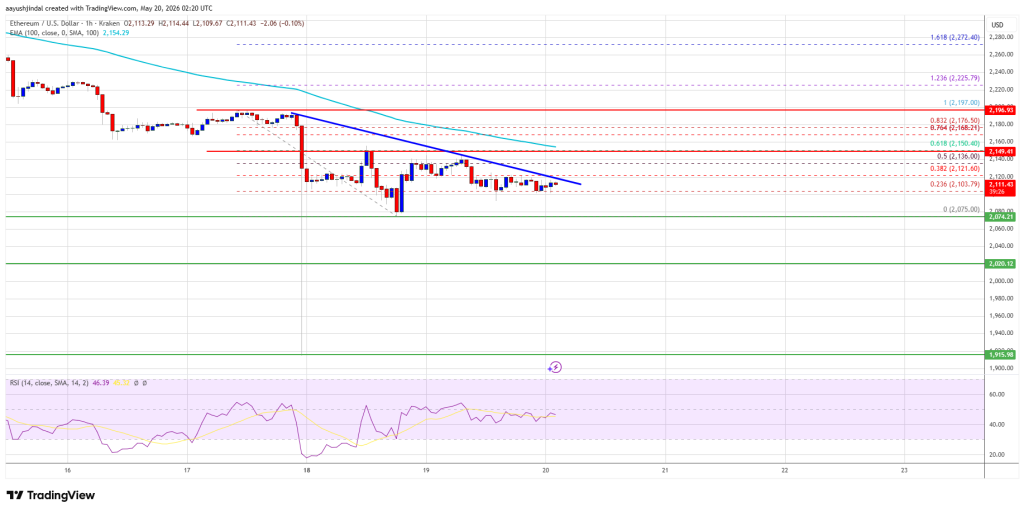
Ethereum Price Bounce Looks Fragile, Another Selloff May Be Brewing
Ethereum price started a recovery wave above the $2,100 zone. ETH is now consoli...
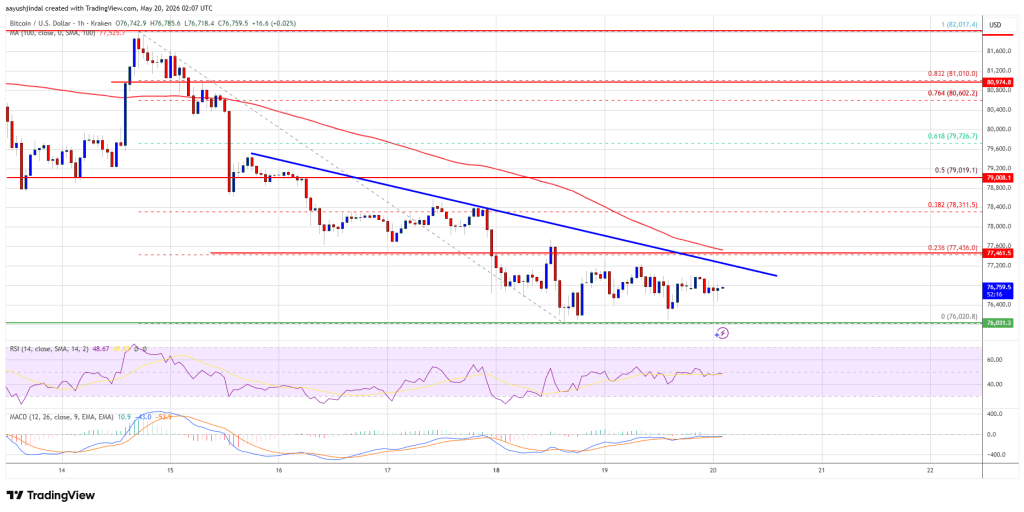
Bitcoin Price Stabilizes Above $76K, Traders Await Next Major Move
Bitcoin price started a fresh decline below the $76,800 zone. BTC is consolidati...