Solana (SOL) Rally Builds, Traders Watch Critical $100 Test
Alex Smith
2 hours ago
Solana started a fresh increase above the $88 zone. SOL price is now consolidating above $90 and might aim for more gains above the $95 zone.
- SOL price started a fresh upward move above the $85 and $88 levels against the US Dollar.
- The price is now trading above $90 and the 100-hourly simple moving average.
- There is a bullish trend line forming with support at $89 on the hourly chart of the SOL/USD pair (data source from Kraken).
- The pair could extend gains if it clears the $95 resistance zone.
Solana Price Regains Traction
Solana price started a decent increase after it settled above the $85 zone, like Bitcoin and Ethereum. SOL climbed above the $88 level to enter a short-term positive zone.
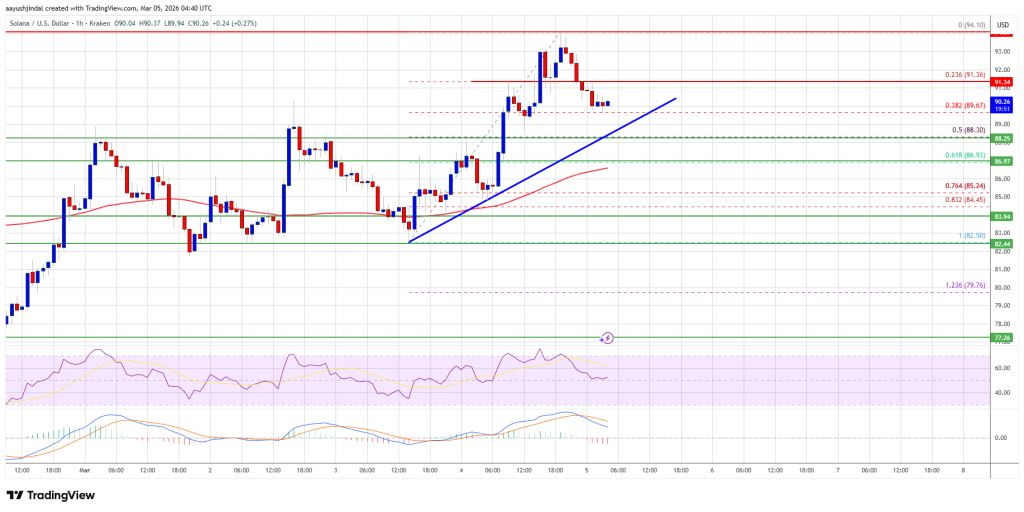
The price even smashed the $90 resistance. The bulls were able to push the price above $92. A high was formed at $94.10, and the price is now consolidating gains. There was a minor decline below the 23.6% Fib retracement level of the recent upward move from the $82.50 swing low to the $94.10 high.
Solana is now trading above $90 and the 100-hourly simple moving average. There is also a bullish trend line forming with support at $89 on the hourly chart of the SOL/USD pair.
On the upside, the price is facing resistance near $92. The next major resistance is near the $95 level. The main resistance could be $100. A successful close above the $100 resistance zone could set the pace for another steady increase. The next key resistance is $108. Any more gains might send the price toward the $112 level.
Downside Correction In SOL?
If SOL fails to rise above the $92 resistance, it could start another decline. Initial support on the downside is near the $90 zone. The first major support is near the $88.50 level and the trend line or the 50% Fib retracement level of the recent upward move from the $82.50 swing low to the $94.10 high.
A break below the $88.50 level might send the price toward the $84 support zone. If there is a close below the $84 support, the price could decline toward the $78 support in the near term.
Technical Indicators
Hourly MACD – The MACD for SOL/USD is losing pace in the bullish zone.
Hourly Hours RSI (Relative Strength Index) – The RSI for SOL/USD is above the 50 level.
Major Support Levels – $90 and $88.50
Major Resistance Levels – $92 and $95.
Related Articles
XRP Price Retests Decade-Old Trendline That Previously Triggered 630%+ Rallies
The XRP price returned to a technical level that, historically, has defined some...
US Should Act On Bitcoin, Not Just Praise It, Ex-Advisor To Trump Says
The US government is sitting on roughly 378,372 Bitcoin worth more than $24 bill...

Manufacturing The Bitcoin Reserve: Inside The Trump Family’s 11,000-Miner Expansion At American Bitcoin
Bitcoin is regaining momentum after reclaiming the $70,000 level, signaling rene...
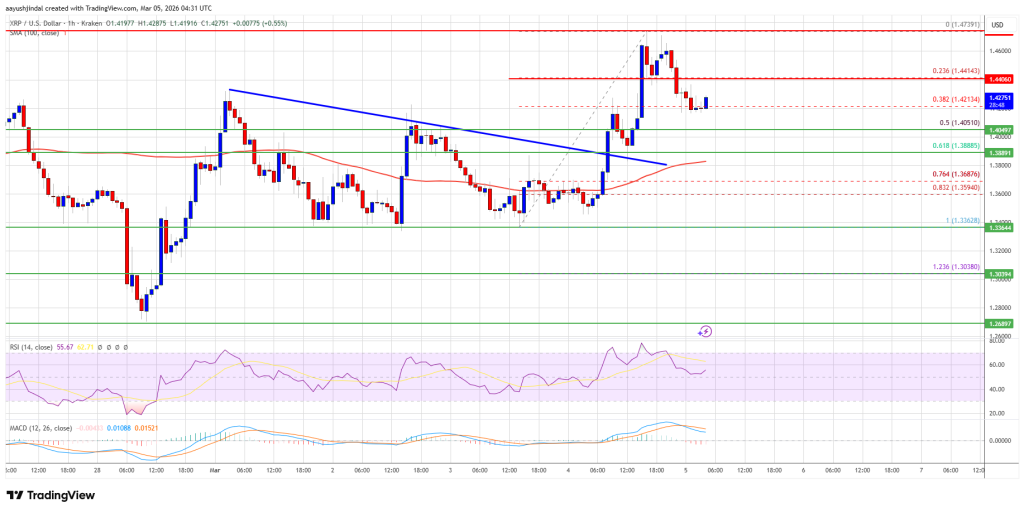
XRP Price Gathers Strength, Traders Anticipate $1.50 Break
XRP price started a decent increase above $1.420. The price is now consolidating...