Solana (SOL) Reclaims 132 Level, Momentum Turns Sharply Bullish
Alex Smith
1 month ago

Solana started a fresh increase above the $130 zone. SOL price is now consolidating above $132 and might aim for more gains above the $138 zone.
- SOL price started a fresh upward move above the $130 and $132 levels against the US Dollar.
- The price is now trading above $132 and the 100-hourly simple moving average.
- There is a bullish trend line forming with support at $135 on the hourly chart of the SOL/USD pair (data source from Kraken).
- The pair could extend gains if it clears the $140 resistance zone.
Solana Price Gains Momentum
Solana price started a decent increase after it settled above the $125 zone, like Bitcoin and Ethereum. SOL climbed above the $130 level to enter a short-term positive zone.
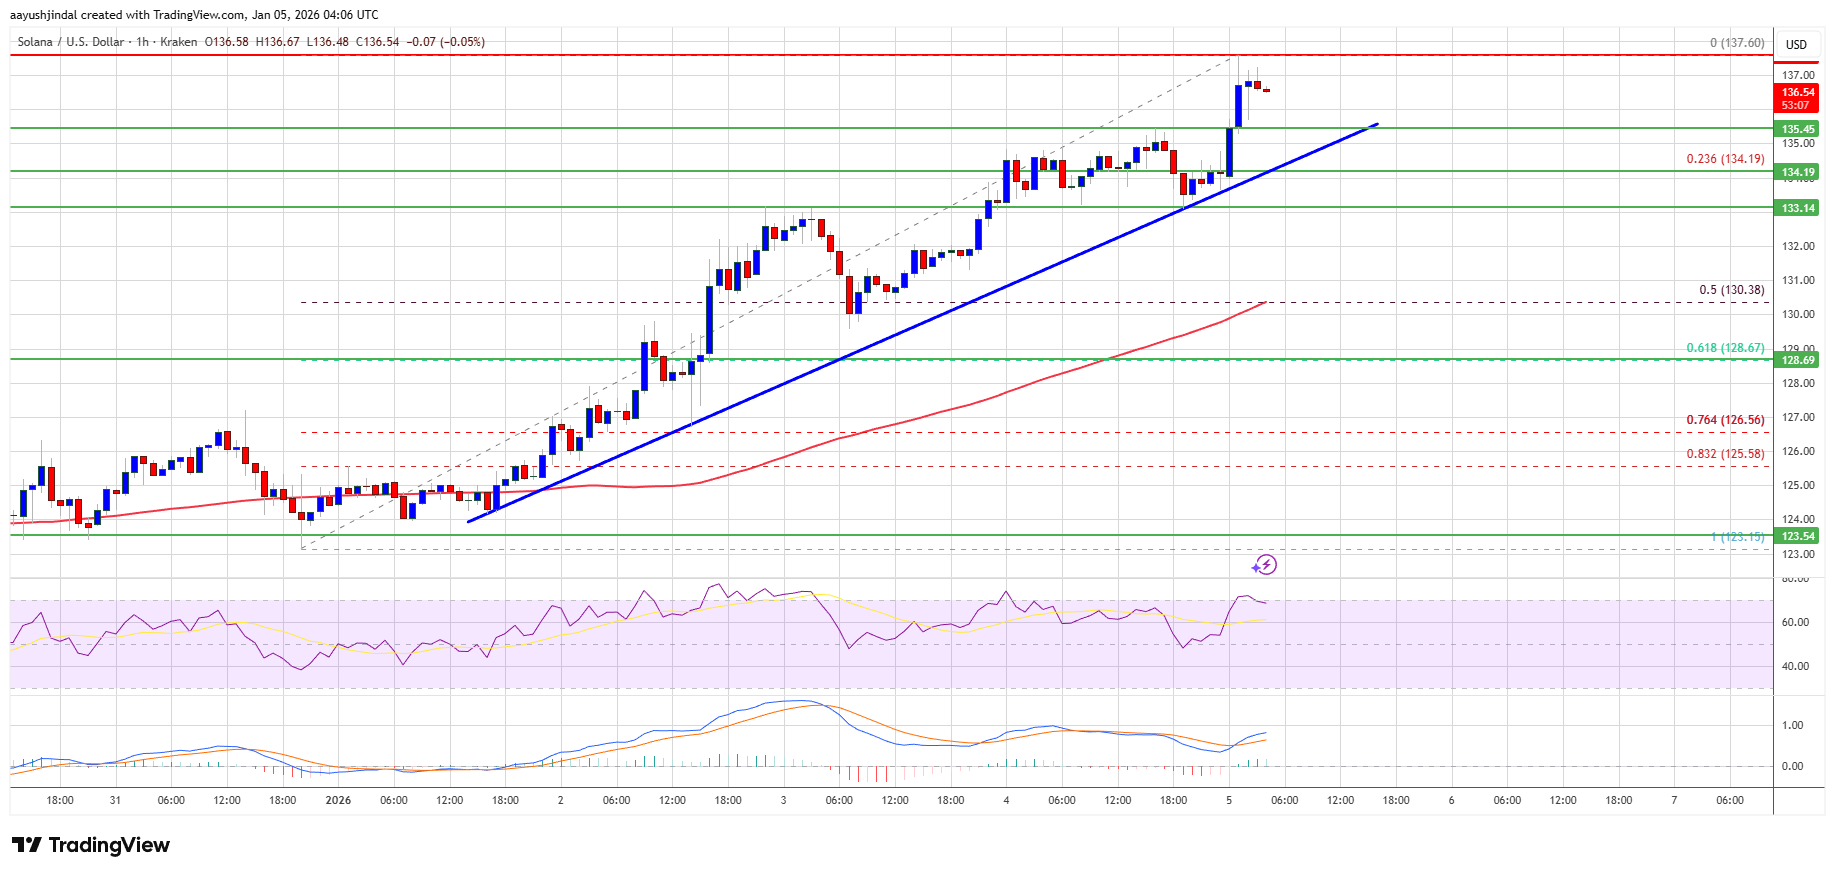
The price even smashed the $132 resistance. The bulls were able to push the price above $135. The price is now consolidating gains above the 23.6% Fib retracement level of the recent upward move from the $123 swing low to the $138 high.
Solana is now trading above $135 and the 100-hourly simple moving average. Besides, there is a bullish trend line forming with support at $135 on the hourly chart of the SOL/USD pair.
On the upside, the price is facing resistance near $138. The next major resistance is near the $140 level. The main resistance could be $145. A successful close above the $145 resistance zone could set the pace for another steady increase. The next key resistance is $150. Any more gains might send the price toward the $155 level.
Another Decline In SOL?
If SOL fails to rise above the $185 resistance, it could start another decline. Initial support on the downside is near the $134 zone and the trend line. The first major support is near the $130 level and the 50% Fib retracement level of the recent upward move from the $123 swing low to the $138 high.
A break below the $130 level might send the price toward the $128 support zone. If there is a close below the $128 support, the price could decline toward the $120 support in the near term.
Technical Indicators
Hourly MACD – The MACD for SOL/USD is gaining pace in the bullish zone.
Hourly Hours RSI (Relative Strength Index) – The RSI for SOL/USD is above the 50 level.
Major Support Levels – $135 and $130.
Major Resistance Levels – $138 and $140.
Related Articles
Is Bitcoin Already Pricing A US Recession? Analyst Sees Major Risk‑Reward Setup
Bitcoin’s (BTC) recent pullback may be less about crypto‑specific weakness and m...

LayerZero (ZRO) Soars 40% Amid Zero Blockchain Debut, Major Institutional Backing
ZRO, the native token of the omnichain interpretability protocol LayerZero, has...

Bitcoin Social Sentiment Stays Bearish Even As Price Recovers From $60,000 Drop
Data shows the social media sentiment around Bitcoin has remained deeply bearish...
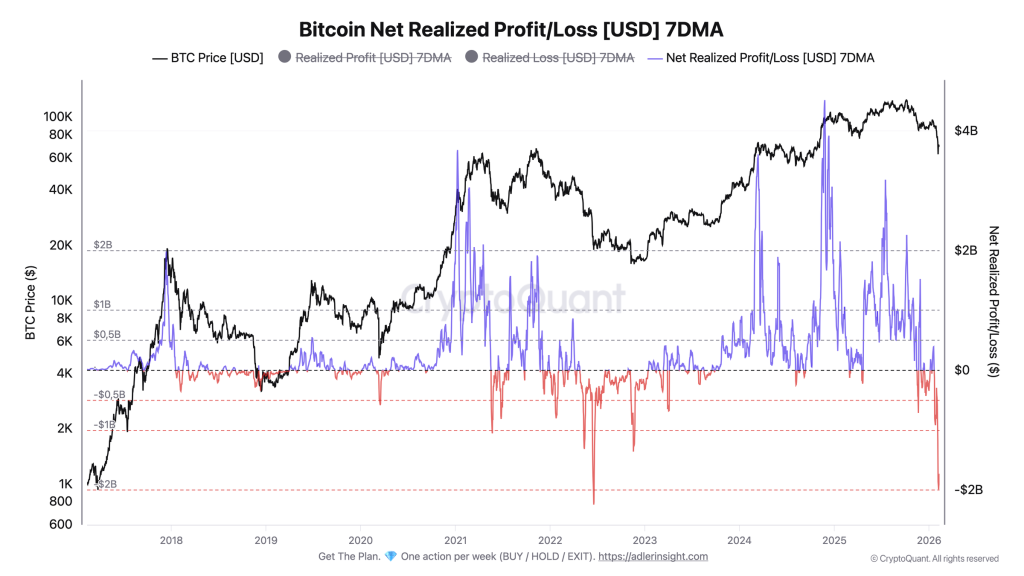
Bitcoin Flashes Luna-Level Capitulation Signal at $67K, Not $19K
Bitcoin is printing on-chain loss-taking on a scale last seen during the Luna/US...