Solana (SOL) Strength Improves, $90 Resistance Keeps Traders Cautious
Alex Smith
2 hours ago
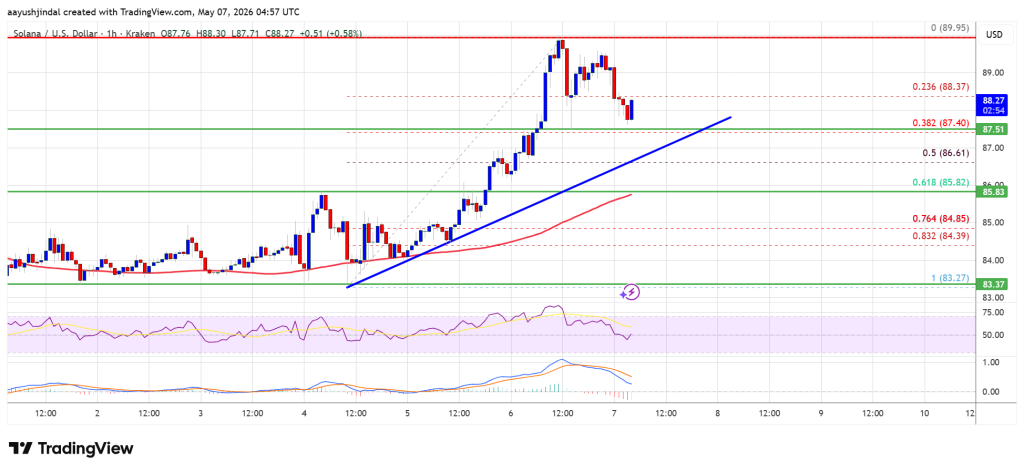
Solana started a fresh increase above the $86 zone. SOL price is now consolidating near $88 and might aim for more gains above the $90 zone.
- SOL price started a fresh upward move above the $85 and $86 levels against the US Dollar.
- The price is now trading above $86 and the 100-hourly simple moving average.
- There is a bullish trend line forming with support at $87.40 on the hourly chart of the SOL/USD pair (data source from Kraken).
- The pair could extend gains if it clears the $90 resistance zone.
Solana Price Starts Fresh Increase
Solana price started a decent increase after it settled above the $85 zone, like Bitcoin and Ethereum. SOL climbed above the $86 level to enter a short-term positive zone.
The price even smashed the $88 resistance. A high was formed at $89.95, and the price is now consolidating gains. There was a minor decline below the 23.6% Fib retracement level of the recent upward move from the $83.27 swing low to the $89.95 high.
Solana is now trading above $87 and the 100-hourly simple moving average. Besides, there is a bullish trend line forming with support at $87.40 on the hourly chart of the SOL/USD pair.
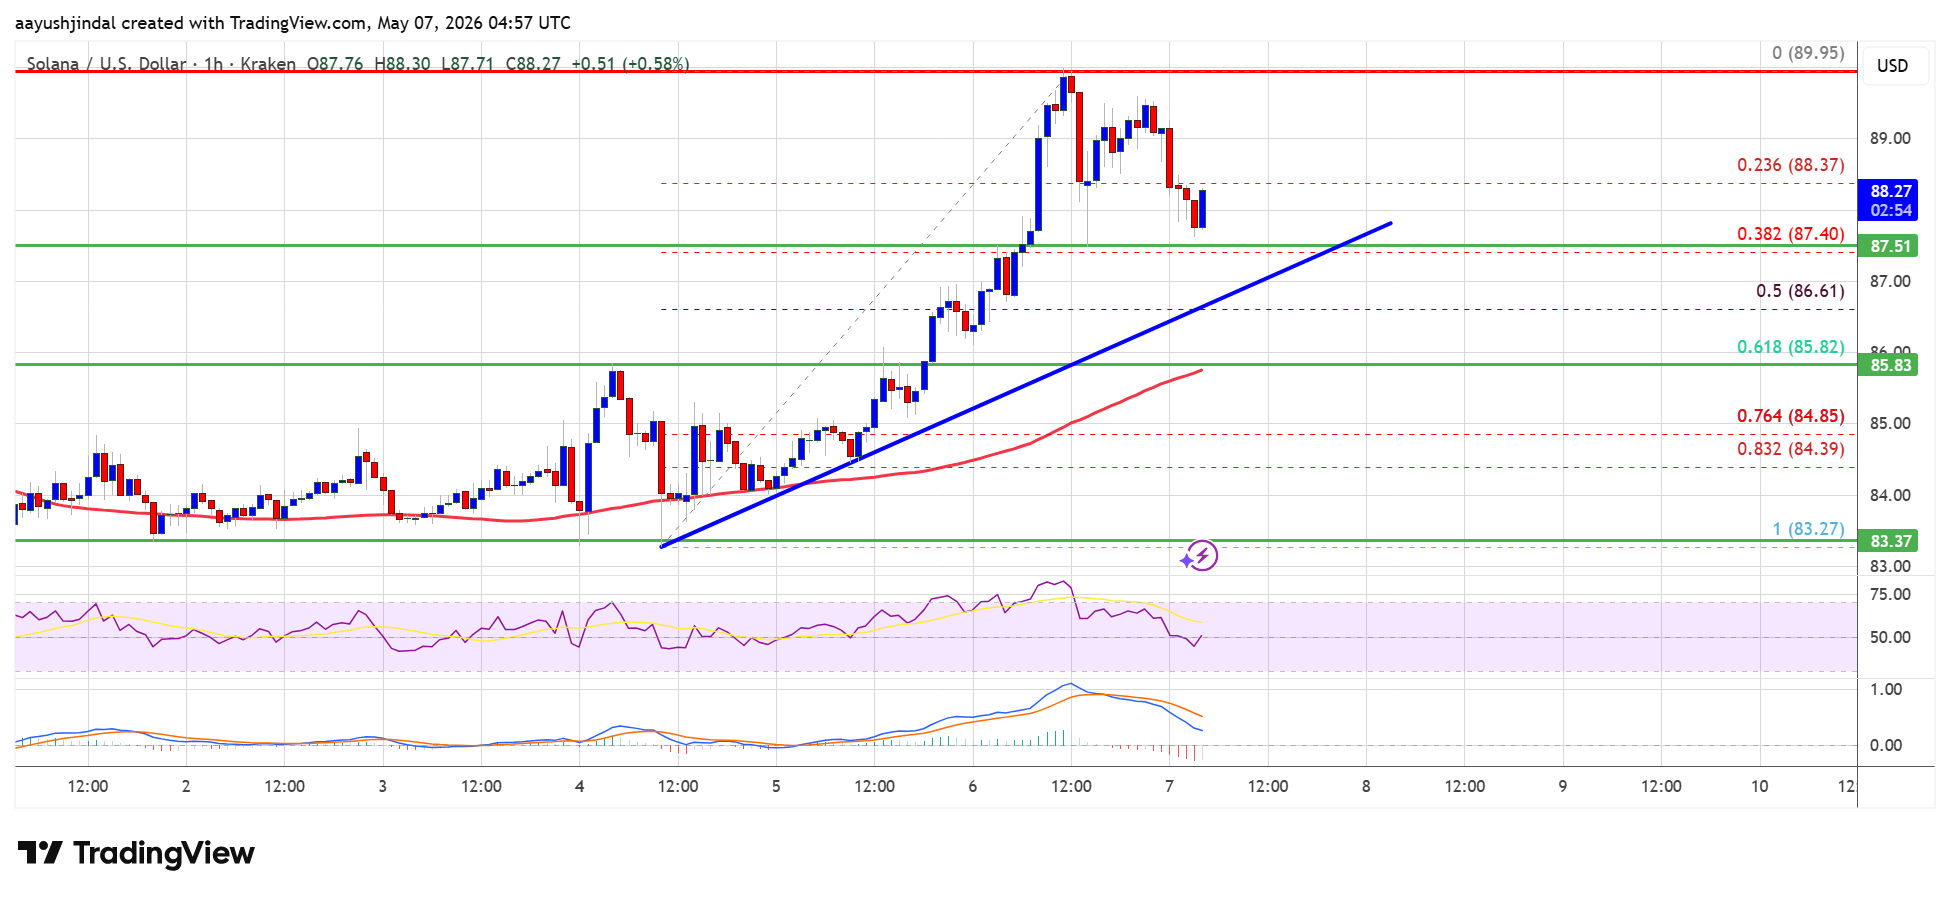
On the upside, the price is facing resistance near $89. The next major resistance is near the $90 level. The main resistance could be $92. A successful close above the $92 resistance zone could set the pace for another steady increase. The next key resistance is $100. Any more gains might send the price toward the $102 level.
Downside Correction In SOL?
If SOL fails to rise above the $90 resistance, it could start another decline. Initial support on the downside is near the $87.40 zone. The first major support is near the $85.80 level and the 61.8% Fib retracement level of the recent upward move from the $83.27 swing low to the $89.95 high.
A break below the $85.80 level might send the price toward the $83.20 support zone. If there is a close below the $82 support, the price could decline toward the $76.50 support in the near term.
Technical Indicators
Hourly MACD – The MACD for SOL/USD is losing pace in the bullish zone.
Hourly Hours RSI (Relative Strength Index) – The RSI for SOL/USD is near the 50 level.
Major Support Levels – $87.40 and $85.80
Major Resistance Levels – $89.00 and $90.00.
Related Articles
Bitcoin At $82K, But Metrics Don’t Smile: Network Activity Down, Spot Demand Negative—What’s Next?
On Wednesday, Bitcoin reached its highest level since January, crossing above th...
XRP Price Weakens Further, Sellers Tighten Grip On Trend
XRP price started a downside correction from the $1.4550 zone. The price is now...

Solana Sees Rising Social Hype, Yet Network Activity Is Falling
Data shows social media sentiment around Solana has been rising recently, but ne...
Ethereum Price Struggles To Hold Strength, Downside Risks Build
Ethereum price started a fresh increase and remained stable above $2,380. ETH is...