Solana (SOL) Turns Lower From Key Zone—Is Support About to Be Tested?
Alex Smith
2 months ago
Solana failed to stay above $142 and corrected gains. SOL price is now trading below $140 and might find bids near the $135 zone.
- SOL price started a downside correction below $142 against the US Dollar.
- The price is now trading above $135 and the 100-hourly simple moving average.
- There is a bullish trend line forming with support at $135 on the hourly chart of the SOL/USD pair (data source from Kraken).
- The pair could extend losses if it dips below the $135 zone.
Solana Price Starts Downside Correction
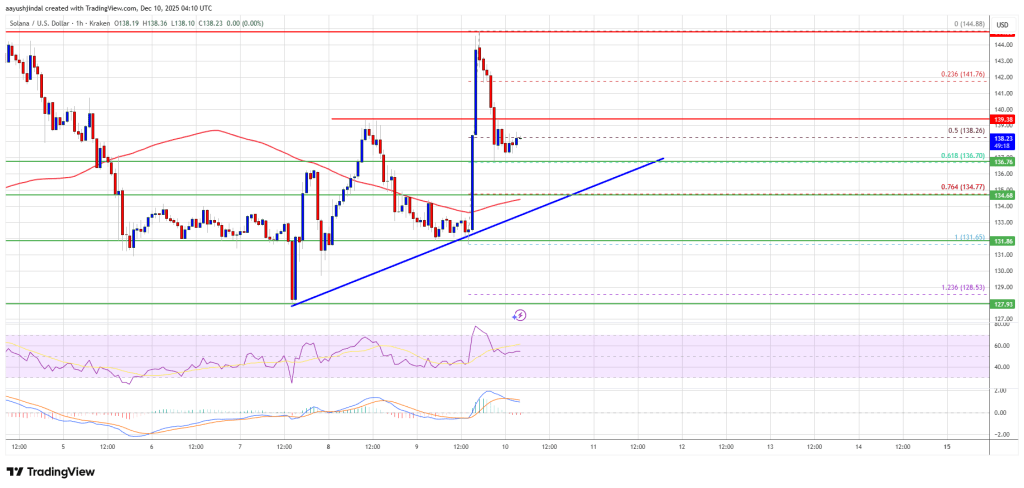
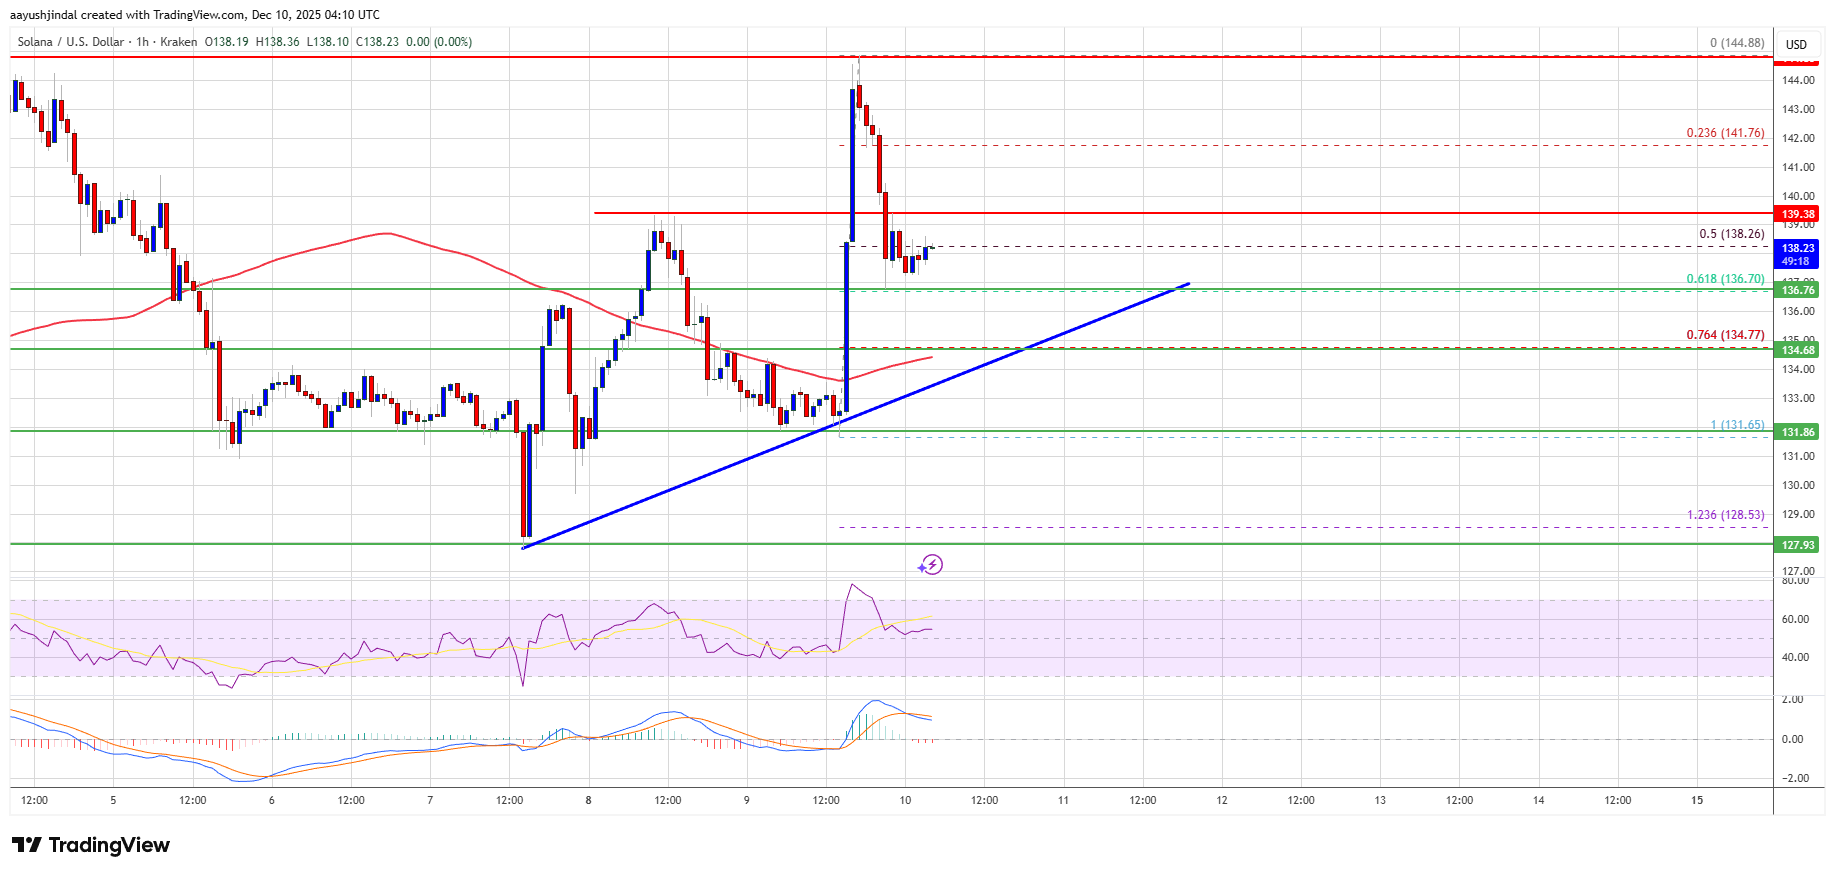
Solana price failed to surpass $145 and started a downside correction, like Bitcoin and Ethereum. SOL dipped below $142 and $140 to enter a short-term bearish zone.
There was a move below the 50% Fib retracement level of the upward wave from the $131 swing low to the $145 high. However, the bulls are active near $136. There is also a bullish trend line forming with support at $135 on the hourly chart of the SOL/USD pair.
Solana is now trading above $135 and the 100-hourly simple moving average. On the upside, the price is facing resistance near the $140 level. The next major resistance is near the $145 level. The main resistance could be $148. A successful close above the $148 resistance zone could set the pace for another steady increase. The next key resistance is $155. Any more gains might send the price toward the $165 level.
More Losses In SOL?
If SOL fails to rise above the $142 resistance, it could start another decline. Initial support on the downside is near the $136 zone and the 61.8% Fib retracement level of the upward wave from the $131 swing low to the $145 high. The first major support is near the $135 level and the trend line.
A break below the $135 level might send the price toward the $132 support zone. If there is a close below the $132 support, the price could decline toward the $125 support in the near term.
Technical Indicators
Hourly MACD – The MACD for SOL/USD is gaining pace in the bearish zone.
Hourly Hours RSI (Relative Strength Index) – The RSI for SOL/USD is below the 50 level.
Major Support Levels – $135 and $132.
Major Resistance Levels – $142 and $145.
Related Articles
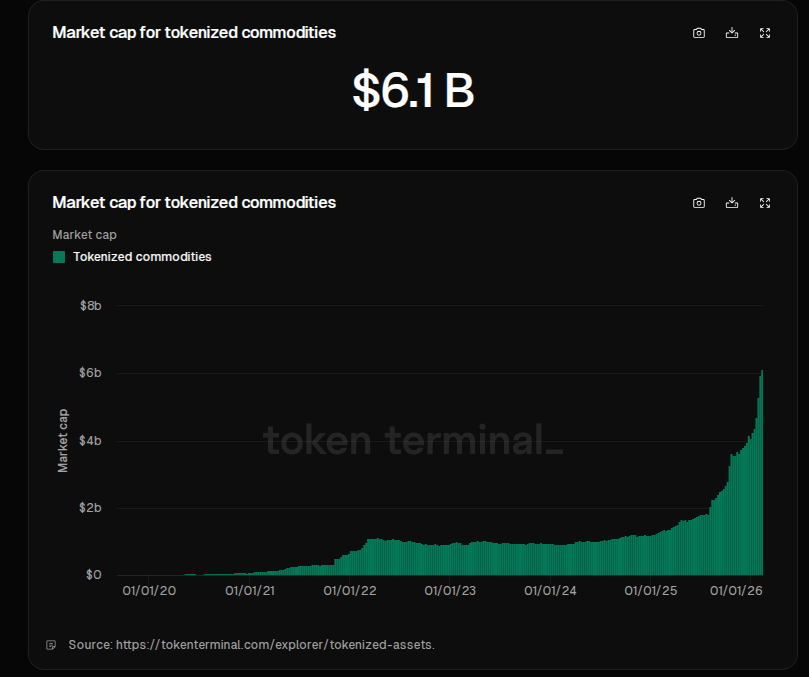
Blockchain Meets Gold: Tokenized Commodities Hit $6 Billion
Markets have put more gold on blockchains, And the shift has been rapid. Reports...

XRP Positioned For Major Structure Shift As Price Tests Critical Level
After recovering from last week’s lows, XRP has been moving sideways, hovering b...

Bitcoin Mogul Erik Voorhees Shifts Millions Into Gold as LiquidChain Presale Climbs
What to Know: Bitcoin’s rebound attempts are still flow-driven; recent US spot B...

Bitcoin Whales Quietly Scoop Up $4.7B in BTC, Pushing Bitcoin Hyper Into the Spotlight
What to Know: Bitcoin whales have added over $4.7B in $BTC, signaling deep convi...